")


This example shows using macros for drawing Karnaugh diagrams. They visualize boolean algebra expressions.
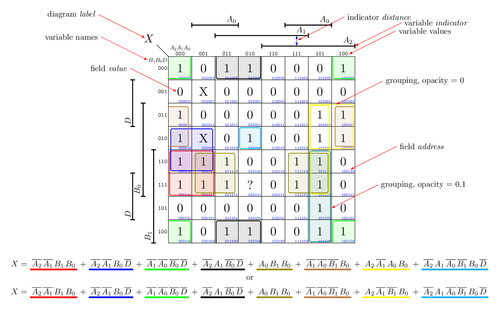
Edit and compile if you like:
% Karnaugh diagram
% Author: Uwe Zimmermann
\documentclass[x11names,border=10pt,tikz]{standalone}
\usepackage{xstring}    % needed for string manipulations
\usepackage{fmtcount}   % needed for some binary printing
\usetikzlibrary{calc,math}
\newif\ifKaddress
\newif\ifKInd
\pgfkeys{
  /K/.is family, /K,
  x bits/.estore in              = \KXvars,     % bits along the horizontal axis
  y bits/.estore in              = \KYvars,     % bits along the vertical axis
  variable names/.estore in      = \KVars,      % comma-separated variable names
  label/.estore in               = \KLabel,     % label for the diagram
  label scale/.estore in         = \KLabelscale,% scale factor for values
  value scale/.estore in         = \KValscale,  % scale factor for values
  variable scale/.estore in      = \KVarscale,  % scale factor for variables
  variable sep/.estore in        = \KVarsep,    % inner sep for variables
  address scale/.estore in       = \KAddrscale, % scale factor for adresses
  address sep/.estore in         = \KAddrsep,   % inner sep for adresses
  group distance/.estore in      = \KGdist,     % distance for grouping lines
  group color/.estore in         = \KGcolor,    % grouping color
  group linewidth/.estore in     = \KGwidth,    % grouping line width
  group rounded/.estore in       = \KGrounded,  % grouping rounded corner radius
  group opacity/.estore in       = \KGopacity,  % grouping field opacity
  indicator distance/.estore in  = \KInddist,   % variable indicator distance
  indicator linewidth/.estore in = \KIndwidth,  % line width for indicators
  indicator scale/.estore in     = \KIndscale,  % scale factor for indicators
  indicator sep/.estore in       = \KIndsep,    % inner sep for indicators
  plot addresses/.is if=Kaddress,               % plot address fields
  plot indicators/.is if=KInd,                  % plot variable indicators
}
\pgfkeys{
  /K,
  default/.style = { plot addresses      = true,
                     plot indicators     = true,
                     x bits              = 2,
                     y bits              = 2,
                     address scale       = 0.5,
                     address sep         = 1pt,
                     variable names      = {$A$,$B$,$C$,$D$,$E$,$F$,$G$},
                     label               = $X$,
                     label scale         = 1.4,
                     variable scale      = 0.7,
                     variable sep        = 2pt,
                     value scale         = 1.5,
                     group color         = red,
                     group rounded       = 2pt,
                     group linewidth     = .3mm,
                     group opacity       = 0.10,
                     group distance      = 0.4,
                     indicator distance  = 0.45,
                     indicator linewidth = .4mm,
                     indicator scale     = 1.0,
                     indicator sep       = 2pt,
                    }
}
\tikzset{
  Kcorners/.style = { rounded corners = \KGrounded },
     Kline/.style = { Kcorners, draw = \KGcolor, line width = \KGwidth },
      KInd/.style = { draw = black, line width = \KIndwidth },
     Kfill/.style = { Kcorners, fill = \KGcolor, opacity = \KGopacity },
     Krect/.style = { Kcorners, Kfill },
     right/.style = { black, anchor = west }, % nodes at right side
      left/.style = { black, anchor = east }, % nodes at left side
}
\let\ol\overline% just to abbreviate

%==============================================================================
% K[options]{table}
%
% takes the address,value pairs from the comma-separated list {table} and
% draws up the corresponding K diagram.
% the table does not need to be sorted, nor to be complete
%
\newcommand{\K}[2][]
{%
  \pgfkeys{/K, default, #1}%
  \def\newstr{#2}
  \tikzmath
  {
    function fromgray(\gcode,\bits) %
    {
      int \x, \pos, \leftbit, \twop;
      \leftbit = 0;
      \pos = 0;
      for \x in {0,...,\bits-1}%
      {
        \twop = 2^(\bits - \x -1);
        if \gcode >= \twop then %
        { % gray code is 1
          if \leftbit == 0 then %
          {
            \pos = \pos + \twop;
            \leftbit = 1;
          } else
          {
            \leftbit = 0;
          };
          \gcode = \gcode - \twop;
        } else
        { % gray code is 0
          if \leftbit == 0 then %
          {
            \pos = \pos;
          } else
          {
            \pos = \pos + \twop;
            \leftbit = 1;
          };
        };
      };
      return \pos;
    };
    %
    int \xbits, \ybits, \fields, \vars;
    \xbits  = \KXvars;
    \ybits  = \KYvars;
    \vars   = \xbits+\ybits;
    \fields = 2^(\vars);
  }
  \StrCut[\xbits]{\KVars}{,}{\xlabels}{\ylabels}
  \StrBefore[\ybits]{\ylabels}{,}[\ylabels]
  \StrSubstitute[0]{\xlabels}{,}{}[\xlabels]
  \StrSubstitute[0]{\ylabels}{,}{}[\ylabels]
  \path ($(0,0.5)+\KVarscale*(0,2ex)$) node[anchor = south,
    inner sep = \KVarsep, scale = \KVarscale] {\ttfamily\xlabels};
  \path (-0.5,0.5) node[anchor = north east,
    inner sep = \KVarsep, scale = \KVarscale] {\ttfamily\ylabels};
  \foreach [remember = \newstr as \workstr (initially \newstr)]
    \i in {1,...,\fields} {%
    \StrCut[2]{\workstr}{,}{\nowstr}{\newstr}
    \StrLen{\newstr}[\len]
    \ifthenelse{\equal{\len}{0}}{\def\newstr{,,}}{}%
    \StrLen{\nowstr}[\len]
    \ifthenelse{\equal{\len}{1}}{}%
    {%
      \StrCut[1]{\nowstr}{,}{\addrstr}{\valuestr}
      \tikzmath{
        int \xpos, \ypos, \xaddr, \yaddr, \addr;
        \addr = 0b\addrstr;
        \xaddr = int(\addr / 2^\ybits);
        \yaddr = \addr - \xaddr * 2^\ybits;
        \xpos = fromgray(\xaddr,\xbits);
        \ypos = fromgray(\yaddr,\ybits);
      } % end tikzmath
      % place field value
      \path ($(\xpos,-\ypos)$) node[anchor=center,
        inner sep = 0pt, scale = \KValscale](F\addrstr){\valuestr};
    }%
  }
  \tikzmath
  {
    int \x, \y, \xmax, \ymax, \value;
    \xmax = 2^\xbits - 1;
    \ymax = 2^\ybits - 1;
    { \draw ($(-0.5,0.5)$) -- ($(-0.5,-\ymax-0.5)$); };
    for \x in {0,...,\xmax}%
    {
      \xpos = fromgray(\x,\xbits);
      {
        \path ($(\xpos,0.5)$) node[anchor = south, black, inner sep = 2pt,
          scale = \KVarscale]{\ttfamily\padzeroes[\xbits]\binarynum{\x}};
        \draw ($(\xpos+0.5,0.5)$) -- ($(\xpos+0.5,-\ymax-0.5)$);
      };
    };
    { \draw ($(-0.5,+0.5)$) -- ($(\xmax+0.5,+0.5)$); };
    for \y in {0,...,\ymax}%
    {
      \ypos = fromgray(\y,\ybits);
      {
        \path ($(-0.5,-\ypos)$) node[anchor=east, black, inner sep = 2pt,
          scale = \KVarscale] {\ttfamily\padzeroes[\ybits]\binarynum{\y}};
        \draw ($(-0.5,-\ypos-0.5)$) -- ($(\xmax+0.5,-\ypos-0.5)$);
      };
    };
  }
  \ifKaddress
  \tikzmath
  {
    int \x, \y, \xmax, \ymax, \value;
    \xmax = 2^\xbits - 1;
    \ymax = 2^\ybits - 1;
    for \x in {0,...,\xmax}%
    {
      \xpos = fromgray(\x,\xbits);
      for \y in {0,...,\ymax}%
      {
        \ypos = fromgray(\y,\ybits);
        { %
            \path ($(\xpos,-\ypos)+(0.5,-0.5)$) node[anchor = south east,
              inner sep = \KAddrsep, blue, scale = \KAddrscale]
              {\ttfamily\padzeroes[\xbits]%
               \binarynum{\x}\padzeroes[\ybits]\binarynum{\y}};
        };
      };
    };
  }
  \fi
  \ifKInd
  \tikzmath%
  {%
    int \i, \il, \j, \n;
    real \x,\xmax,\y,\ymax;
    for \i in {1,...,\xbits}%
    {
      \n = 2^(\i-2);
      \il = \i+1;
      if \n < 1 then {\n=1;};
      \y = 0.5 + \KInddist*(\i);
      for \j in {1,...,\n}%
      {
        \x = -0.5 + 2^(\xbits-\i) + (\j-1)*2^(\xbits-\i+2);
        \xmax = \x + 2^(\xbits-\i+1);
        if \xmax > (2^(\xbits)-0.5) then {\xmax=2^(\xbits)-0.5;};
        {
          \StrBetween[\i,\numexpr\i+1]{,\KVars,}{,}{,}[\tlabel]
          \path [KInd] (\x,\y) -- (\xmax,\y) node[anchor = south east,
               inner sep = \KIndsep, scale = \KIndscale] {\tlabel};
          \path [KInd] (\x,\y)++(0,-0.1)    -- ++(0,+0.2);
          \path [KInd] (\xmax,\y)++(0,-0.1) -- ++(0,+0.2);
        };
      };
    };
    for \i in {1,...,\ybits}%
    {
      \n = 2^(\i-2);
      if \n < 1 then {\n=1;};
      \x = -0.5 - \KInddist*(\i-1);
      for \j in {1,...,\n}%
      {
        \y = -0.5 + 2^(\ybits-\i) + (\j-1)*2^(\ybits-\i+2);
        \ymax = \y + 2^(\ybits-\i+1);
        if \ymax > (2^(\ybits)-0.5) then {\ymax=2^(\ybits)-0.5;};
        {
          \StrBetween[\numexpr\i+\xbits,\numexpr\i+\xbits+1]
            {,\KVars,}{,}{,}[\tlabel]
          \path [KInd] ($(\x,-\y)-\ybits*(1.4ex,0)$)
            -- ($(\x,-\ymax)-\ybits*(1.4ex,0)$) node[anchor=south west,
                rotate=90, inner sep=\KIndsep, scale=\KIndscale]{\tlabel};
          \path [KInd] ($(\x,-\y)-\ybits*(1.4ex,0)$)++(-0.1,0) -- ++(+0.2,0);
          \path [KInd] ($(\x,-\ymax)-\ybits*(1.4ex,0)$)++(-0.1,0) -- ++(+0.2,0);
        };
      };
    };
  }
  \fi
  \path[draw = black] (-0.5,0.5) -- ++(-0.5,0.5) node[anchor = south east,
    inner sep = 2pt, scale = \KLabelscale] {\KLabel};
}

%==============================================================================
% KG[options]{from}{to}
%
% groups together the fields between {from} and {to} by drawing a frame around
% these fields.
% if the {from} field is above or right of the {to} field, the frame is
% extended around the edge of the diagram.
%
\newcommand{\KG}[3][] % options from to
{%
  \pgfkeys{/K, default, #1}%
  \tikzmath
  {
    int \xbits, \ybits, \fields, \vars;
    \xbits = \KXvars;
    \ybits = \KYvars;
    \vars  = \xbits+\ybits;
    \fields = 2^(\vars);
  }
  \tikzmath{
    int \xfrompos, \yfrompos, \xfrom, \yfrom, \fromaddr;
    int \xtopos, \ytopos, \xto, \yto, \toaddr;
    \fromaddr = 0b#2;
    \toaddr   = 0b#3;
    \xfrom    = int(\fromaddr / 2^\ybits);
    \yfrom    = \fromaddr - \xfrom * 2^\ybits;
    \xto      = int(\toaddr / 2^\ybits);
    \yto      = \toaddr - \xto * 2^\ybits;
    \xfrompos = fromgray(\xfrom,\xbits);
    \yfrompos = fromgray(\yfrom,\ybits);
    \xtopos   = fromgray(\xto,\xbits);
    \ytopos   = fromgray(\yto,\ybits);
    \xmax     = 2^\xbits-1;
    \ymax     = 2^\ybits-1;
  } % end tikzmath
  \tikzmath%
  {
    if (\xfrompos <= \xtopos) && (\yfrompos >= \ytopos) then %
    {
      {
        \path[Kfill] ($(\xfrompos,-\yfrompos)-(\KGdist,\KGdist)$)
          rectangle ($(\xtopos,-\ytopos)+(\KGdist,\KGdist)$);
        \path[Kline] ($(\xfrompos,-\yfrompos)-(\KGdist,\KGdist)$)
          rectangle ($(\xtopos,-\ytopos)+(\KGdist,\KGdist)$);
      };
    };
    if (\xfrompos <= \xtopos) && (\yfrompos < \ytopos) then %
    {
      {
        \path[Krect] ($(\xfrompos,0)+(-\KGdist,+0.5)$)
          -- ($(\xfrompos,-\yfrompos)+(-\KGdist,-\KGdist)$)
          -- ($(\xtopos,-\yfrompos)+(\KGdist,-\KGdist)$)
          -- ($(\xtopos,0)+(\KGdist,+0.5)$) -- cycle;
        \path[Krect] ($(\xfrompos,-\ymax)+(-\KGdist,-0.5)$)
          -- ($(\xfrompos,-\ytopos)+(-\KGdist,+\KGdist)$)
          -- ($(\xtopos,-\ytopos)+(\KGdist,+\KGdist)$)
          -- ($(\xtopos,-\ymax)+(\KGdist,-0.5)$) -- cycle;
        \path[Kline] ($(\xfrompos,0)+(-\KGdist,+0.5)$)
          -- ($(\xfrompos,-\yfrompos)+(-\KGdist,-\KGdist)$)
          -- ($(\xtopos,-\yfrompos)+(\KGdist,-\KGdist)$)
          -- ($(\xtopos,0)+(\KGdist,+0.5)$);
        \path[Kline] ($(\xfrompos,-\ymax)+(-\KGdist,-0.5)$)
        -- ($(\xfrompos,-\ytopos)+(-\KGdist,+\KGdist)$)
        -- ($(\xtopos,-\ytopos)+(\KGdist,+\KGdist)$)
        -- ($(\xtopos,-\ymax)+(\KGdist,-0.5)$);
      };
    };
    if (\xfrompos > \xtopos) && (\yfrompos >= \ytopos) then %
    {
      {
        \path[Krect] ($(0,-\yfrompos)+(-0.5,-\KGdist)$)
          -- ($(\xtopos,-\yfrompos)+(+\KGdist,-\KGdist)$)
          -- ($(\xtopos,-\ytopos)+(\KGdist,+\KGdist)$)
          -- ($(0,-\ytopos)+(-0.5,+\KGdist)$) -- cycle;
        \path[Krect] ($(\xmax,-\yfrompos)+(+0.5,-\KGdist)$)
          -- ($(\xfrompos,-\yfrompos)+(-\KGdist,-\KGdist)$)
          -- ($(\xfrompos,-\ytopos)+(-\KGdist,+\KGdist)$)
          -- ($(\xmax,-\ytopos)+(+0.5,+\KGdist)$) -- cycle;
        \path[Kline] ($(0,-\yfrompos)+(-0.5,-\KGdist)$)
          -- ($(\xtopos,-\yfrompos)+(+\KGdist,-\KGdist)$)
          -- ($(\xtopos,-\ytopos)+(\KGdist,+\KGdist)$)
          -- ($(0,-\ytopos)+(-0.5,+\KGdist)$);
        \path[Kline] ($(\xmax,-\yfrompos)+(+0.5,-\KGdist)$)
          -- ($(\xfrompos,-\yfrompos)+(-\KGdist,-\KGdist)$)
          -- ($(\xfrompos,-\ytopos)+(-\KGdist,+\KGdist)$)
          -- ($(\xmax,-\ytopos)+(+0.5,+\KGdist)$);
      };
    };
    if (\xfrompos > \xtopos) && (\yfrompos < \ytopos) then %
    {
      {
        \path[Kfill] {[Kcorners] ($(0,-\yfrompos)+(-0.5,-\KGdist)$)
          -- ($(\xtopos,-\yfrompos)+(+\KGdist,-\KGdist)$)
          -- ($(\xtopos,0)+(\KGdist,+0.5)$)}
          -- ($(0,0)+(-0.5,+0.5)$) -- cycle;
        \path[Kfill] {[Kcorners] ($(0,-\ytopos)+(-0.5,+\KGdist)$)
          -- ($(\xtopos,-\ytopos)+(+\KGdist,+\KGdist)$)
          -- ($(\xtopos,-\ymax)+(\KGdist,-0.5)$)}
          -- ($(0,-\ymax)+(-0.5,-0.5)$) -- cycle;
        \path[Kfill] {[Kcorners] ($(\xmax,-\yfrompos)+(+0.5,-\KGdist)$)
          -- ($(\xfrompos,-\yfrompos)+(-\KGdist,-\KGdist)$)
          -- ($(\xfrompos,0)+(-\KGdist,+0.5)$)}
          -- ($(\xmax,0)+(+0.5,+0.5)$) -- cycle;
        \path[Kfill] {[Kcorners] ($(\xmax,-\ytopos)+(+0.5,+\KGdist)$)
          -- ($(\xfrompos,-\ytopos)+(-\KGdist,+\KGdist)$)
          -- ($(\xfrompos,-\ymax)+(-\KGdist,-0.5)$)}
          -- ($(\xmax,-\ymax)+(+0.5,-0.5)$) -- cycle;
        \path[Kline] ($(0,-\yfrompos)+(-0.5,-\KGdist)$)
          -- ($(\xtopos,-\yfrompos)+(+\KGdist,-\KGdist)$)
          -- ($(\xtopos,0)+(\KGdist,+0.5)$);
        \path[Kline] ($(0,-\ytopos)+(-0.5,+\KGdist)$)
          -- ($(\xtopos,-\ytopos)+(+\KGdist,+\KGdist)$)
          -- ($(\xtopos,-\ymax)+(\KGdist,-0.5)$);
        \path[Kline] ($(\xmax,-\yfrompos)+(+0.5,-\KGdist)$)
          -- ($(\xfrompos,-\yfrompos)+(-\KGdist,-\KGdist)$)
          -- ($(\xfrompos,0)+(-\KGdist,+0.5)$);
        \path[Kline] ($(\xmax,-\ytopos)+(+0.5,+\KGdist)$)
          -- ($(\xfrompos,-\ytopos)+(-\KGdist,+\KGdist)$)
          -- ($(\xfrompos,-\ymax)+(-\KGdist,-0.5)$);
      };
    };
  }

}

\newcommand*\ul[2]{\tikz[baseline = (char.base)]{
  \node[inner sep = 2pt] (char) {#2};
  \draw[#1, line width = 2pt](char.south west) -- (char.south east);}}

\begin{document}
  \begin{tikzpicture}[x=1cm,y=1cm]
    \K[x bits = 3, y bits = 3,
       variable names = {$A_2$,$A_1$,$A_0$,$B_1$,$B_0$,$D$,}]
    { % some random truth table...
      000000,1,    010000,1,     100000,1,    110000,0,
      000001,0,    010001,0,     100001,0,    110001,0,
      000010,1,    010010,1,     100010,1,    110010,0,
      000011,1,    010011,0,     100011,1,    110011,0,
      000100,1,    010100,1,     100100,1,    110100,0,
      000101,0,    010101,0,     100101,0,    110101,0,
      000110,1,    010110,0,     100110,0,    110110,0,
      000111,1,    010111,?,     100111,0,    110111,0,
      001000,0,    011000,1,     101000,0,    111000,0,
      001001,X,    011001,0,     101001,0,    111001,0,
      001010,X,    011010,0,     101010,1,    111010,0,
      001011,0,    011011,0,     101011,1,    111011,0,
      001100,0,    011100,1,     101100,1,    111100,0,
      001101,0,    011101,0,     101101,1,    111101,0,
      001110,1,    011110,1,     101110,1,    111110,1,
      001111,1,    011111,1,     101111,1,    111111,1,
    }
    \newcommand*{\myKG}[4][0.1]{\KG[x bits = 3,y bits = 3,group opacity = #1,
                  #2]{#3}{#4}}
    \myKG     {group color = green,  group distance=0.45}{100000}{000100}
    \myKG     {group color = red,    group distance=0.45}{000111}{001110}
    \myKG     {group color = blue,   group distance=0.40}{000110}{001010}
    \myKG     {group color = olive,  group distance=0.35}{001111}{011110}
    \myKG     {group color = olive,  group distance=0.35}{111111}{101110}
    \myKG     {group color = brown,  group distance=0.35}{100010}{000011}
    \myKG     {group color = black,  group distance=0.45}{011000}{010100}
    \myKG     {group color = cyan,   group distance=0.45}{010010}{010010}
    \myKG     {group color = teal,   group distance=0.45}{101100}{101110}
    \myKG[0.0]{group color = yellow, group distance=0.40}{101111}{101011}
    \myKG[0.0]{group color = yellow, group distance=0.45}{101010}{100011}
    %=====================================================================
    % in picture comments
    %=====================================================================
    \begin{scope}[latex-,red]
      \draw (6.7,-1.55)  -- ++(2,1)  node[right] {grouping, opacity = 0};
      \draw (6.5,-6.0)   -- ++(2,1)  node[right] {grouping, opacity = 0.1};
      \draw (7.5,+0.95)  -- ++(2,1)  node[right] {variable \emph{indicator}};
      \draw (7.3,-4.35)  -- ++(2,1)  node[right] {field \emph{address}};
      \draw (7.25,+0.6)  -- ++(2,1)  node[right] {variable values};
      \draw (-1.5,+1.3)  -- ++(-2,1) node[left]  {diagram \emph{label}};
      \draw (-1.4,+0.35) -- ++(-2,1) node[left]  {variable names};
      \draw (-0.15,-1.0) -- ++(-2,1) node[left]  {field \emph{value}};
      \draw (5.05,1.2)   -- ++(2,1)  node[right] {indicator \emph{distance}};
    \end{scope}
    \draw [latex-latex,blue] (5,0.95) -- ++(0,0.45);
    \path (3,-8) node[anchor = north, align = left] (eq1){%
    $X =
       \ul{red}{$\ol{A_2}\,\ol{A_1}\,B_1\,B_0$}
      +\ul{blue}{$\ol{A_2}\,\ol{A_1}\,B_0\,\ol{D}$}
      +\ul{green}{$\ol{A_1}\,\ol{A_0}\,\ol{B_0}\,\ol{D}$}
      +\ul{black}{$\ol{A_2}\,A_1\,\ol{B_0}\,\ol{D}$}
      +\ul{olive}{$A_0\,{B_1}\,{B_0}$}
      +\ul{brown}{$\ol{A_1}\,\ol{A_0}\,\ol{B_1}\,{B_0}$}
      +\ul{yellow}{${A_2}\,\ol{A_1}\,{A_0}\,{B_0}$}
      +\ul{cyan}{$\ol{A_2}\,{A_1}\,\ol{A_0}\,\ol{B_1}\,{B_0}\,\ol{D}$}
    $};
    \path(eq1.south) node[anchor = north] (t1) {or};
    \path (t1.south) node[anchor = north, align = left] (eq2){%
    $X =
       \ul{red}{$\ol{A_2}\,\ol{A_1}\,B_1\,B_0$}
      +\ul{blue}{$\ol{A_2}\,\ol{A_1}\,B_0\,\ol{D}$}
      +\ul{green}{$\ol{A_1}\,\ol{A_0}\,\ol{B_0}\,\ol{D}$}
      +\ul{black}{$\ol{A_2}\,A_1\,\ol{B_0}\,\ol{D}$}
      +\ul{olive}{$A_0\,{B_1}\,{B_0}$}
      +\ul{brown}{$\ol{A_1}\,\ol{A_0}\,\ol{B_1}\,{B_0}$}
      +\ul{yellow}{${A_2}\,\ol{A_1}\,\ol{B_1}\,{B_0}$}
      +\ul{cyan}{$\ol{A_2}\,{A_1}\,\ol{A_0}\,\ol{B_1}\,{B_0}\,\ol{D}$}
    $};
  \end{tikzpicture}
\end{document}
Click to download: karnaugh-diagram.tex • karnaugh-diagram.pdf
Open in Overleaf: karnaugh-diagram.tex