")


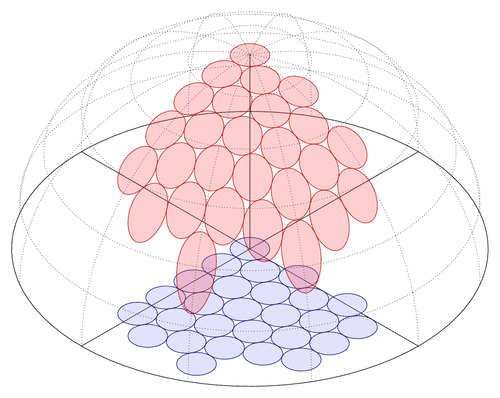
Here we got a semi sphere. On the base area we place circles, which are then projected onto the surface of sphere.
Using polar coordinates for the circles seems to be a good choice, but for now we take cartesian coordinates. We draw using layers.
This example was written by Mark Wibrow answering a question on TeX.SE.
Edit and compile if you like:
% Projection of circles onto a spherical surface
% Author: Mark Wibrow
\documentclass[tikz,border=10pt]{standalone}
\begin{document}
\pgfdeclarelayer{dome floor}
\pgfdeclarelayer{dome}
\pgfdeclarelayer{dome surface}
\pgfsetlayers{dome floor,main,dome,dome surface}

\def\addcircle#1#2#3#4{%
    \begingroup%
        \pgfmathparse{#1}\let\R=\pgfmathresult
        \pgfmathparse{#2}\let\cx=\pgfmathresult
        \pgfmathparse{#3}\let\cy=\pgfmathresult
        \pgfmathparse{#4}\let\r=\pgfmathresult
        \begin{pgfonlayer}{dome floor}
            \draw [blue!45!black, fill = blue!45, fill opacity = 0.25]
                plot [domain = 0:360, samples = 40, variable = \i]
                    (\cx+\r*cos \i, \cy+\r*sin \i, 0) -- cycle;
        \end{pgfonlayer}
        \begin{pgfonlayer}{dome surface}
            \draw [red!75!black, fill = red!75, fill opacity = 0.25]
                plot [domain = 0:360, samples = 60, variable = \t]
                    (\cx+\r*cos \t,\cy+\r*sin \t,
                    {sqrt(max(\R^2-(\cx+\r*cos(\t))^2-(\cy+\r*sin(\t))^2, 0))})
                    -- cycle;
        \end{pgfonlayer}
    \endgroup%
}
\begin{tikzpicture}[x = (-30:1cm), y = (30:1cm), z = (90:1cm)]
\def\R{6}

\begin{pgfonlayer}{dome floor}
    \draw (-\R,0,0) -- (\R,0,0);
    \draw (0,-\R,0) -- (0,\R,0);
    \draw plot [domain = 0:360, samples = 90, variable = \i]
        (\R*cos \i, \R*sin \i, 0) -- cycle;
\end{pgfonlayer}

\draw (0,0,0) -- (0,0,\R);

\begin{pgfonlayer}{dome surface}
    \foreach \i in {0, 30,...,150}
            \draw [dotted] plot [domain = -90:90, samples = 60, variable = \j]
                (\R*cos \i*sin \j,\R*sin \i*sin \j, \R*cos \j);
    \foreach \j in {0, 15,...,90}
            \draw [dotted] plot [domain = 0:360, samples = 60, variable = \i]
                    (\R*cos \i*sin \j,\R*sin \i*sin \j, \R*cos \j);
\end{pgfonlayer}

\def\r{0.5}
\foreach \m [evaluate = {\N=max(-4, \m-7);}]in {0,...,5}{
    \foreach \n in {0,-1,...,\N}
        {\addcircle{\R}{\m*sin 60}{\n-mod(abs(\m),2)*\r}{\r}}}
\end{tikzpicture}
\end{document}
Click to download: dome.tex • dome.pdf
Open in Overleaf: dome.tex