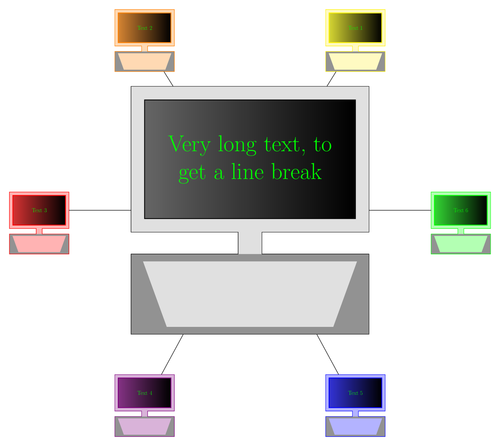
TikZ 3.0 introduced the pic element, which works like a combination of node and tikzpicture features. Here we create a pic for a computer, which can be used several times with modified appearance.
This example was written by Elke Schubert on TeXwelt.de. http://texwelt.de/wissen/fragen/3536/wie-erstelle-ich-neue-shapes-in-tikz

Edit and compile if you like:
% Computer diagram
% Author: Elke Schubert
\documentclass[tikz,border=10pt]{standalone}
\usetikzlibrary{fit}
\tikzset{
  comp/.style = {
    minimum width  = 8cm,
    minimum height = 4.5cm,
    text width     = 8cm,
    inner sep      = 0pt,
    text           = green,
    align          = center,
    font           = \Huge,
    transform shape,
    thick
  },
  monitor/.style = {draw = none, xscale = 18/16, yscale = 11/9},
  display/.style = {shading = axis, left color = black!60, right color = black},
  ut/.style      = {fill = gray}
}
\tikzset{
  computer/.pic = {
    % screen (with border)
    \node(-m) [comp, pic actions, monitor]
      {\phantom{\parbox{\linewidth}{\tikzpictext}}};
    % display (without border)
    \node[comp, pic actions, display] {\tikzpictext};
    \begin{scope}[x = (-m.east), y = (-m.north)]
      % filling the lower part
      \path[pic actions, draw = none]
        ([yshift=2\pgflinewidth]-0.1,-1) -- (-0.1,-1.3) -- (-1,-1.3) --
        (-1,-2.4) -- (1,-2.4) -- (1,-1.3) -- (0.1,-1.3) --
        ([yshift=2\pgflinewidth]0.1,-1);
      % filling the border of the lower part
      \path[ut]
        (-1,-2.4) rectangle (1,-1.3)
        (-0.9,-1.4) -- (-0.7,-2.3) -- (0.7,-2.3) -- (0.9,-1.4) -- cycle;
      % drawing the frame of the whole computer
      \path[pic actions, fill = none]
        (-1,1) -- (-1,-1) -- (-0.1,-1) -- (-0.1,-1.3) -- (-1,-1.3) --
        (-1,-2.4) coordinate(sw)coordinate[pos=0.5] (-b west) --
        (1,-2.4) -- (1,-1.3) coordinate[pos=0.5] (-b east) --
        (0.1,-1.3) -- (0.1,-1) -- (1,-1) -- (1,1) -- cycle;
      % node around the whole computer
      \node(-c) [fit = (sw)(-m.north east), inner sep = 0pt] {};
    \end{scope}
  }
}
% We have two rectangle nodes with the common anchors available
% screen (with border): -m, whole computer: -c
% The anchor of the whole pic is -m.center and cannot be changed
\begin{document}
\begin{tikzpicture}
  \pic(comp0) [
    draw,
    fill = gray!30,
    pic text = {Very long text, to get a line break}
  ]
  {computer};
  \path(comp0-c.center) pic
    foreach[count=\i] \farbe in {yellow, orange, red, red!50!blue, blue, green}
    (comp\i) [
      draw = \farbe,
      fill = \farbe!30,
      display/.append style = {left color=\farbe!80!black!80},
      scale = 0.25,
      pic text = {Text \i}
    ] at +(60*\i:8){computer};
  \foreach \i in {1,2,4,5} \draw (comp\i-c) -- (comp0-c);
  \foreach \i in {3,6} \draw (comp\i-m) -- (comp0-c);
\end{tikzpicture}
\end{document}
Click to download: computer-diagram.tex • computer-diagram.pdf
Open in Overleaf: computer-diagram.tex


