


The grid is drawn by hand and with some basic loops, such as concentric circles and labels in a foreach loop. The shaded area got opacity so we can see through.
This example was written by Alex Chan (http://tex.stackexchange.com/users/9668/alexwlchan) answering a question on TeX.SE (http://tex.stackexchange.com/q/169624/213).
Edit and compile if you like:
\documentclass[tikz]{standalone}
\begin{document}
\begin{tikzpicture}[>=latex]
% Draw the lines at multiples of pi/12
\foreach \ang in {0,...,31} {
\draw [lightgray] (0,0) -- (\ang * 180 / 16:4);
}
% Concentric circles and radius labels
\foreach \s in {0, 1, 2, 3} {
\draw [lightgray] (0,0) circle (\s + 0.5);
\draw (0,0) circle (\s);
\node [fill=white] at (\s, 0) [below] {\scriptsize $\s$};
}
% Add the labels at multiples of pi/4
\foreach \ang/\lab/\dir in {
0/0/right,
1/{\pi/4}/{above right},
2/{\pi/2}/above,
3/{3\pi/4}/{above left},
4/{\pi}/left,
5/{5\pi/4}/{below left},
7/{7\pi/4}/{below right},
6/{3\pi/2}/below} {
\draw (0,0) -- (\ang * 180 / 4:4.1);
\node [fill=white] at (\ang * 180 / 4:4.2) [\dir] {\scriptsize $\lab$};
}
% The double-lined circle around the whole diagram
\draw [style=double] (0,0) circle (4);
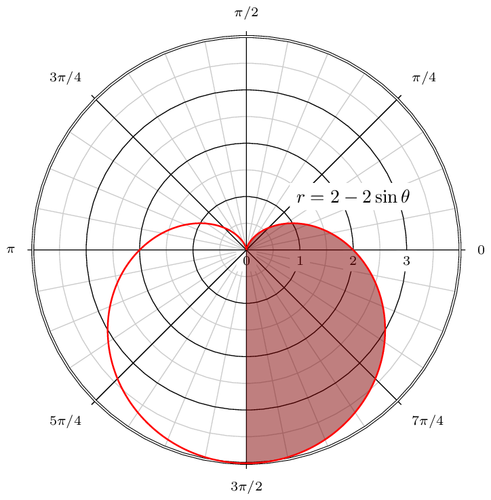
\fill [fill=red!50!black, opacity=0.5] plot [domain=-pi/2:pi/2]
(xy polar cs:angle=\x r, radius= {2-2*sin(\x r)});
\draw [thick, color=red, domain=0:2*pi, samples=200, smooth]
plot (xy polar cs:angle=\x r, radius={2-2*sin(\x r)});
\node [fill=white] at (2,1) {$r=2-2\sin\theta$};
\end{tikzpicture}
\end{document}Click to download: polar-plot.tex • polar-plot.pdf
Open in Overleaf: polar-plot.tex