")


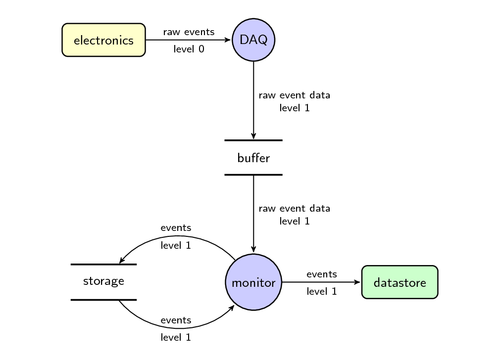
Data flow diagrams depict the flow of information in a system. This figure shows experimental data being recorded, processed and ultimately stored. This figure is a minor revision of the one included in [my PhD thesis](http://dx.doi.org/10.3990/1.9789036534383).
Edit and compile if you like:
% Data flow diagram
% Author: David Fokkema
\documentclass{article}
\usepackage{tikz}
\usepackage[active,tightpage]{preview}
\PreviewEnvironment{center}
\setlength\PreviewBorder{10pt}%
\usetikzlibrary{arrows}

% Defines a `datastore' shape for use in DFDs.  This inherits from a
% rectangle and only draws two horizontal lines.
\makeatletter
\pgfdeclareshape{datastore}{
  \inheritsavedanchors[from=rectangle]
  \inheritanchorborder[from=rectangle]
  \inheritanchor[from=rectangle]{center}
  \inheritanchor[from=rectangle]{base}
  \inheritanchor[from=rectangle]{north}
  \inheritanchor[from=rectangle]{north east}
  \inheritanchor[from=rectangle]{east}
  \inheritanchor[from=rectangle]{south east}
  \inheritanchor[from=rectangle]{south}
  \inheritanchor[from=rectangle]{south west}
  \inheritanchor[from=rectangle]{west}
  \inheritanchor[from=rectangle]{north west}
  \backgroundpath{
    %  store lower right in xa/ya and upper right in xb/yb
    \southwest \pgf@xa=\pgf@x \pgf@ya=\pgf@y
    \northeast \pgf@xb=\pgf@x \pgf@yb=\pgf@y
    \pgfpathmoveto{\pgfpoint{\pgf@xa}{\pgf@ya}}
    \pgfpathlineto{\pgfpoint{\pgf@xb}{\pgf@ya}}
    \pgfpathmoveto{\pgfpoint{\pgf@xa}{\pgf@yb}}
    \pgfpathlineto{\pgfpoint{\pgf@xb}{\pgf@yb}}
 }
}
\makeatother

\begin{document}
\begin{center}
\begin{tikzpicture}[
  font=\sffamily,
  every matrix/.style={ampersand replacement=\&,column sep=2cm,row sep=2cm},
  source/.style={draw,thick,rounded corners,fill=yellow!20,inner sep=.3cm},
  process/.style={draw,thick,circle,fill=blue!20},
  sink/.style={source,fill=green!20},
  datastore/.style={draw,very thick,shape=datastore,inner sep=.3cm},
  dots/.style={gray,scale=2},
  to/.style={->,>=stealth',shorten >=1pt,semithick,font=\sffamily\footnotesize},
  every node/.style={align=center}]

  % Position the nodes using a matrix layout
  \matrix{
    \node[source] (hisparcbox) {electronics};
      \& \node[process] (daq) {DAQ}; \& \\

    \& \node[datastore] (buffer) {buffer}; \& \\

    \node[datastore] (storage) {storage};
      \& \node[process] (monitor) {monitor};
      \& \node[sink] (datastore) {datastore}; \\
  };

  % Draw the arrows between the nodes and label them.
  \draw[to] (hisparcbox) -- node[midway,above] {raw events}
      node[midway,below] {level 0} (daq);
  \draw[to] (daq) -- node[midway,right] {raw event data\\level 1} (buffer);
  \draw[to] (buffer) --
      node[midway,right] {raw event data\\level 1} (monitor);
  \draw[to] (monitor) to[bend right=50] node[midway,above] {events}
      node[midway,below] {level 1} (storage);
  \draw[to] (storage) to[bend right=50] node[midway,above] {events}
      node[midway,below] {level 1} (monitor);
  \draw[to] (monitor) -- node[midway,above] {events}
      node[midway,below] {level 1} (datastore);
\end{tikzpicture}
\end{center}
\end{document}
Click to download: data-flow-diagram.tex • data-flow-diagram.pdf
Open in Overleaf: data-flow-diagram.tex