


This example is from the tutorial: A picture for Karl's students.
Author: Till Tantau Source: The PGF/TikZ manual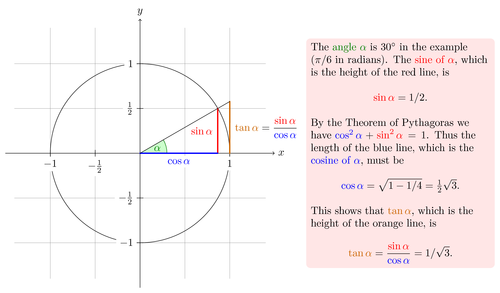
Edit and compile if you like:
% Author: Till Tantau
% Source: The PGF/TikZ manual
\documentclass{minimal}

\usepackage{tikz}
%\usetikzlibrary{trees,snakes}

\begin{document}
\pagestyle{empty}


\begin{tikzpicture}[scale=3,cap=round]
  % Local definitions
  \def\costhirty{0.8660256}

  % Colors
  \colorlet{anglecolor}{green!50!black}
  \colorlet{sincolor}{red}
  \colorlet{tancolor}{orange!80!black}
  \colorlet{coscolor}{blue}

  % Styles
  \tikzstyle{axes}=[]
  \tikzstyle{important line}=[very thick]
  \tikzstyle{information text}=[rounded corners,fill=red!10,inner sep=1ex]

  % The graphic
  \draw[style=help lines,step=0.5cm] (-1.4,-1.4) grid (1.4,1.4);

  \draw (0,0) circle (1cm);

  \begin{scope}[style=axes]
    \draw[->] (-1.5,0) -- (1.5,0) node[right] {$x$};
    \draw[->] (0,-1.5) -- (0,1.5) node[above] {$y$};

    \foreach \x/\xtext in {-1, -.5/-\frac{1}{2}, 1}
      \draw[xshift=\x cm] (0pt,1pt) -- (0pt,-1pt) node[below,fill=white]
            {$\xtext$};

    \foreach \y/\ytext in {-1, -.5/-\frac{1}{2}, .5/\frac{1}{2}, 1}
      \draw[yshift=\y cm] (1pt,0pt) -- (-1pt,0pt) node[left,fill=white]
            {$\ytext$};
  \end{scope}

  \filldraw[fill=green!20,draw=anglecolor] (0,0) -- (3mm,0pt) arc(0:30:3mm);
  \draw (15:2mm) node[anglecolor] {$\alpha$};

  \draw[style=important line,sincolor]
    (30:1cm) -- node[left=1pt,fill=white] {$\sin \alpha$} +(0,-.5);

  \draw[style=important line,coscolor]
    (0,0) -- node[below=2pt,fill=white] {$\cos \alpha$} (\costhirty,0);

  \draw[style=important line,tancolor] (1,0) --
    node [right=1pt,fill=white]
    {
      $\displaystyle \tan \alpha \color{black}=
      \frac{{\color{sincolor}\sin \alpha}}{\color{coscolor}\cos \alpha}$
    } (intersection of 0,0--30:1cm and 1,0--1,1) coordinate (t);

  \draw (0,0) -- (t);

  \draw[xshift=1.85cm] node [right,text width=6cm,style=information text]
    {
      The {\color{anglecolor} angle $\alpha$} is $30^\circ$ in the
      example ($\pi/6$ in radians). The {\color{sincolor}sine of
        $\alpha$}, which is the height of the red line, is
      \[
      {\color{sincolor} \sin \alpha} = 1/2.
      \]
      By the Theorem of Pythagoras we have ${\color{coscolor}\cos^2 \alpha} +
      {\color{sincolor}\sin^2\alpha} =1$. Thus the length of the blue
      line, which is the {\color{coscolor}cosine of $\alpha$}, must be
      \[
      {\color{coscolor}\cos\alpha} = \sqrt{1 - 1/4} = \textstyle
      \frac{1}{2} \sqrt 3.
      \]%
      This shows that {\color{tancolor}$\tan \alpha$}, which is the
      height of the orange line, is
      \[
      {\color{tancolor}\tan\alpha} = \frac{{\color{sincolor}\sin
          \alpha}}{\color{coscolor}\cos \alpha} = 1/\sqrt 3.
      \]%
    };
\end{tikzpicture}

\end{document}
Click to download: tutorial.tex • tutorial.pdf
Open in Overleaf: tutorial.tex