


A collection of plots created with the TikZ-based tkz-plot2d package. Provides among other things, convenient macros for creating axes and grids.
Requires GNUPLOT. Documentation only available in French.
Edit and compile if you like:
% Demonstration of tkz-plot2d
% Author: Alain Matthes
% Note: Requires GNUPLOT
\documentclass{article}
\usepackage[usenames,dvipsnames]{xcolor}
\usepackage{tikz,tkz-plot2d,amsmath}
\usetikzlibrary{arrows}%
\usepackage[np,autolanguage]{numprint}
\begin{document}
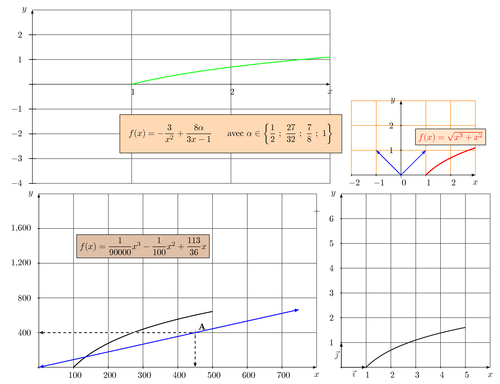
\begin{tikzpicture}[xscale=4,yscale=1]
\tkzinit[xmax=3,ymax=3,ymin=-4];
\tkzgrid
\tkzx
\tkzy
\tkzfct[color=red](0.35..3){-3/(x*x) +4/(3*x-1)}
\tkzfct[color=blue](0.35..3){-3/(x*x) +27/(4*(3*x-1))}
\tkzfct[color=orange](0.35..3){-3/(x*x) +8/(3*x-1)}
\tkzfct[color=green](0.35..3){-3/(x*x) +7/(3*x-1)}
\node[draw,inner sep =10pt,fill=orange!30] at (2,-2)%
{$f(x)=-\dfrac{3}{x^2}+\dfrac{8\alpha}{3x-1}$%
\hspace{.5cm} avec%
\ $\alpha \in%
\left\{\dfrac{1}{2}~;~\dfrac{27}{32}~;~\dfrac{7}{8}~;~1\right\}$};
\end{tikzpicture}%
%
\begin{tikzpicture}[scale=1]
\tkzinit[xmin=-2,xmax=3,ymax=3]
\tkzgrid[color=orange](-2,0)(3,3)
\tkzx[orig]
\tkzy
\tkzfct[label = false,%
samples = 200,%
lw = 1pt,
color = red](-1..2)%
{(x*x*x+x*x)**(0.5)}
\tkztg{\tkzfcta}(0)
\tkztxt[style = {draw},%
color = red,%
bkgcolor = orange!20](2,1)%
{$f(x)=\sqrt{x^3+x^2}$}
\end{tikzpicture}\\%
%
%
\begin{tikzpicture}[scale=1.4]%
\tkzinit[xmax=800,xstep=100,ymax=2000,ystep=400]
\tkzgrid[xstep=100,ystep=400](0,0)(800,2000)
\tkzx
\tkzy
\tkzfct[lw=0.8pt](0..800)%
{(1./90000)*\x*\x*\x-(1./100)*\x*\x+(113./36)*\x}
\tkzpt[coord](450,400){A}
\tkzpt(800,1800){}
\tkztg[color=blue,lw=.8pt,kr=300,kl=450]{\tkzfcta}(450)
\tkztxt[style = draw,%
color = black,%
bkgcolor = bistre!50]%
(300,1200)%
{$f(x)=\dfrac{1}{90000}x^3 -\dfrac{1}{{100}}x^2 +\dfrac{113}{36}x$}
\end{tikzpicture}%
%
\begin{tikzpicture}%
\tkzinit[xmax=6,ymax=7]
\tkzgrid(0,0)(6,7)
\tkzx
\tkzy
\tkzfct[label=false](0..6){x}
\tkzfct[label=false](6..-0.5){log(x)}
\tkzairefg[color=orange!60](1..5){\tkzfctgnua}{\tkzfctgnub}
\rep%
\end{tikzpicture}%
\end{document}
Click to download: tkz-plot2d.tex • tkz-plot2d.pdf
Open in Overleaf: tkz-plot2d.tex