


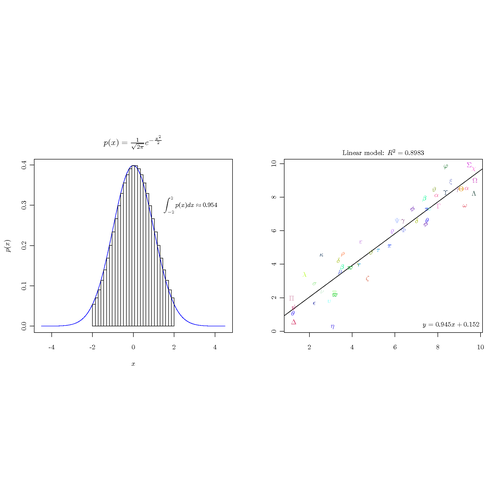
An example of output from the R package tikzDevice . R plotting command are output at a very low level as TikZ commands. tikzDevice combines the computational power of R with the graphical beauty of and font consistancy of TikZ. For details please see the vignette available with the package, available here.
The following R code was used to generate the first plot:
#Load the tikzDevice package, if you dont have it, install with:
#  install.packages("tikzDevice", repos="http://R-Forge.R-project.org")
require(tikzDevice)
# The following wwill create normal.tex in the working
# directory the first time this is run it may take a long time because the
# process of calulating string widths for proper placement is
# computationally intensive, the results will get cached for the current R
# session or will get permenantly cached if you set
# options( tikzMetricsDictionary='/path/to/dictionary' ) which will be
# created if it does not exist.  Also if the flag standAlone is not set to
# TRUE then a file is created which can be included with \include{}
tikz('normal.tex', standAlone = TRUE, width=5, height=5)
# Normal distribution curve
x <- seq(-4.5,4.5,length.out=100)
y <- dnorm(x)
# Integration points
xi <- seq(-2,2,length.out=30)
yi <- dnorm(xi)
# plot the curve
plot(x,y,type='l',col='blue',ylab='$p(x)$',xlab='$x$')
# plot the panels
lines(xi,yi,type='s')
lines(range(xi),c(0,0))
lines(xi,yi,type='h')
#Add some equations as labels
title(main="$p(x)=\\frac{1}{\\sqrt{2\\pi}}e^{-\\frac{x^2}{2}}$")
int <- integrate(dnorm,min(xi),max(xi),subdivisions=length(xi))
text(2.8, 0.3, paste("\\small$\\displaystyle\\int_{", min(xi),
    "}^{", max(xi), "}p(x)dx\\approx", round(int[['value']],3),
    '$', sep=''))
#Close the device
dev.off()
# Compile the tex file
tools::texi2dvi('normal.tex',pdf=T)
# optionally view it:
# system(paste(getOption('pdfviewer'),'normal.pdf'))
The second plot:
#Load the tikzDevice package, if you dont have it, install with:
#  install.packages("tikzDevice", repos="http://R-Forge.R-project.org")
require(tikzDevice)
#Names of LaTeX symbols
syms <- c('alpha','theta','tau','beta','vartheta','pi','upsilon','gamma',
          'varpi','phi','delta','kappa','rho','varphi','epsilon','lambda',
          'varrho','chi','varepsilon','mu','sigma','psi','zeta','nu',
          'varsigma','omega','eta','xi','Gamma','Lambda','Sigma','Psi',
          'Delta', 'Xi','Upsilon','Omega','Theta','Pi','Phi')
len <- length(syms)
# random colors (red, green, blue)
r <- round(runif(len), 2)
g <- round(runif(len), 2)
b <- round(runif(len), 2)
# calculate dummy data points
x <- runif(50,1,10)
y <- x + rnorm(length(x))
fit <- lm(y ~ x)
rsq <- summary(fit)$r.squared
rsq <- signif(rsq,4)
# plot the result, will create symbol-regression.tex in the working
# directory the first time this is run it may take a long time because the
# process of calulating string widts for proper placement is
# computationally intensive, the results will get cached for the current R
# session or will get permenantly cached if you set
# options( tikzMetricsDictionary='/path/to/dictionary' ) which will be
# created if it does not exist.  Also if the flag standAlone is not set to
# TRUE then a file is created which can be included with \include{}
tikz('symbol-regression.tex',standAlone = TRUE, width = 5,height = 5)
# plot the box and the regression line
plot(x, y, type='n', xlab='', ylab='')
box()
abline(fit)
# add the latex symbols as points
text(x, y, paste('\\color[rgb]{',r,',',g,',',b,'}{$\\',syms,'$}',sep=''))
# Display the correlation coefficient
mtext(paste("Linear model: $R^{2}=",rsq,"$" ),line=0.5)
# and the equation of the line
legend('bottomright', legend = paste("$y = ", round(coef(fit)[2],3),
    'x +', round(coef(fit)[1],3), '$', sep=''), bty= 'n')
# Close the device
dev.off()
# Compile the tex file
tools::texi2dvi('symbol-regression.tex',pdf=T)
# optionally view it:
# system(paste(getOption('pdfviewer'),'symbol-regression.pdf'))
Edit and compile if you like:
% tikzDevice demonstration
% Author: Cameron Bracken
\documentclass{article}
\usepackage{tikz}

\usepackage[active,tightpage]{preview}
\PreviewEnvironment{tikzpicture}
\setlength\PreviewBorder{0pt}%


\begin{document}

% Created by tikzDevice
\begin{tikzpicture}[x=1pt,y=1pt]
\draw[color=white,opacity=0] (0,0) rectangle (361.35,361.35);
\begin{scope}
\path[clip] ( 49.20, 61.20) rectangle (336.15,312.15);
\definecolor[named]{drawColor}{rgb}{0.25,0.33,0.33}
\definecolor[named]{fillColor}{rgb}{0.00,0.85,0.14}
\definecolor[named]{drawColor}{rgb}{0.00,0.00,1.00}
\definecolor[named]{fillColor}{rgb}{1.00,1.00,1.00}

\draw[color=drawColor,line cap=round,line join=round,] ( 59.83, 70.49) --
	( 62.51, 70.50) --
	( 65.20, 70.51) --
	( 67.88, 70.52) --
	( 70.56, 70.53) --
	( 73.25, 70.55) --
	( 75.93, 70.58) --
	( 78.61, 70.62) --
	( 81.30, 70.67) --
	( 83.98, 70.75) --
	( 86.67, 70.85) --
	( 89.35, 70.99) --
	( 92.03, 71.18) --
	( 94.72, 71.43) --
	( 97.40, 71.76) --
	(100.08, 72.19) --
	(102.77, 72.74) --
	(105.45, 73.44) --
	(108.14, 74.34) --
	(110.82, 75.46) --
	(113.50, 76.87) --
	(116.19, 78.59) --
	(118.87, 80.71) --
	(121.55, 83.26) --
	(124.24, 86.32) --
	(126.92, 89.96) --
	(129.61, 94.23) --
	(132.29, 99.20) --
	(134.97,104.93) --
	(137.66,111.45) --
	(140.34,118.82) --
	(143.03,127.03) --
	(145.71,136.10) --
	(148.39,146.00) --
	(151.08,156.68) --
	(153.76,168.05) --
	(156.44,180.02) --
	(159.13,192.45) --
	(161.81,205.16) --
	(164.50,217.98) --
	(167.18,230.69) --
	(169.86,243.06) --
	(172.55,254.85) --
	(175.23,265.83) --
	(177.91,275.76) --
	(180.60,284.42) --
	(183.28,291.61) --
	(185.97,297.17) --
	(188.65,300.94) --
	(191.33,302.86) --
	(194.02,302.86) --
	(196.70,300.94) --
	(199.38,297.17) --
	(202.07,291.61) --
	(204.75,284.42) --
	(207.44,275.76) --
	(210.12,265.83) --
	(212.80,254.85) --
	(215.49,243.06) --
	(218.17,230.69) --
	(220.85,217.98) --
	(223.54,205.16) --
	(226.22,192.45) --
	(228.91,180.02) --
	(231.59,168.05) --
	(234.27,156.68) --
	(236.96,146.00) --
	(239.64,136.10) --
	(242.32,127.03) --
	(245.01,118.82) --
	(247.69,111.45) --
	(250.38,104.93) --
	(253.06, 99.20) --
	(255.74, 94.23) --
	(258.43, 89.96) --
	(261.11, 86.32) --
	(263.80, 83.26) --
	(266.48, 80.71) --
	(269.16, 78.59) --
	(271.85, 76.87) --
	(274.53, 75.46) --
	(277.21, 74.34) --
	(279.90, 73.44) --
	(282.58, 72.74) --
	(285.27, 72.19) --
	(287.95, 71.76) --
	(290.63, 71.43) --
	(293.32, 71.18) --
	(296.00, 70.99) --
	(298.68, 70.85) --
	(301.37, 70.75) --
	(304.05, 70.67) --
	(306.74, 70.62) --
	(309.42, 70.58) --
	(312.10, 70.55) --
	(314.79, 70.53) --
	(317.47, 70.52) --
	(320.15, 70.51) --
	(322.84, 70.50) --
	(325.52, 70.49);
\end{scope}
\begin{scope}
\path[clip] (  0.00,  0.00) rectangle (361.35,361.35);
\definecolor[named]{drawColor}{rgb}{0.25,0.33,0.33}
\definecolor[named]{fillColor}{rgb}{0.00,0.85,0.14}
\definecolor[named]{drawColor}{rgb}{0.00,0.00,0.00}
\definecolor[named]{fillColor}{rgb}{1.00,1.00,1.00}

\draw[color=drawColor,line cap=round,line join=round,fill=fillColor,] ( 74.59, 61.20) -- (310.76, 61.20);

\draw[color=drawColor,line cap=round,line join=round,fill=fillColor,] ( 74.59, 61.20) -- ( 74.59, 55.20);

\draw[color=drawColor,line cap=round,line join=round,fill=fillColor,] (133.63, 61.20) -- (133.63, 55.20);

\draw[color=drawColor,line cap=round,line join=round,fill=fillColor,] (192.68, 61.20) -- (192.68, 55.20);

\draw[color=drawColor,line cap=round,line join=round,fill=fillColor,] (251.72, 61.20) -- (251.72, 55.20);

\draw[color=drawColor,line cap=round,line join=round,fill=fillColor,] (310.76, 61.20) -- (310.76, 55.20);

\node[color=drawColor,anchor=base,inner sep=0pt, outer sep=0pt, scale=  1.00] at ( 74.59, 37.20) {-4};

\node[color=drawColor,anchor=base,inner sep=0pt, outer sep=0pt, scale=  1.00] at (133.63, 37.20) {-2};

\node[color=drawColor,anchor=base,inner sep=0pt, outer sep=0pt, scale=  1.00] at (192.68, 37.20) {0};

\node[color=drawColor,anchor=base,inner sep=0pt, outer sep=0pt, scale=  1.00] at (251.72, 37.20) {2};

\node[color=drawColor,anchor=base,inner sep=0pt, outer sep=0pt, scale=  1.00] at (310.76, 37.20) {4};

\draw[color=drawColor,line cap=round,line join=round,fill=fillColor,] ( 49.20, 70.49) -- ( 49.20,303.71);

\draw[color=drawColor,line cap=round,line join=round,fill=fillColor,] ( 49.20, 70.49) -- ( 43.20, 70.49);

\draw[color=drawColor,line cap=round,line join=round,fill=fillColor,] ( 49.20,128.79) -- ( 43.20,128.79);

\draw[color=drawColor,line cap=round,line join=round,fill=fillColor,] ( 49.20,187.10) -- ( 43.20,187.10);

\draw[color=drawColor,line cap=round,line join=round,fill=fillColor,] ( 49.20,245.41) -- ( 43.20,245.41);

\draw[color=drawColor,line cap=round,line join=round,fill=fillColor,] ( 49.20,303.71) -- ( 43.20,303.71);

\node[rotate= 90.00,color=drawColor,anchor=base,inner sep=0pt, outer sep=0pt, scale=  1.00] at ( 37.20, 70.49) {0.0};

\node[rotate= 90.00,color=drawColor,anchor=base,inner sep=0pt, outer sep=0pt, scale=  1.00] at ( 37.20,128.79) {0.1};

\node[rotate= 90.00,color=drawColor,anchor=base,inner sep=0pt, outer sep=0pt, scale=  1.00] at ( 37.20,187.10) {0.2};

\node[rotate= 90.00,color=drawColor,anchor=base,inner sep=0pt, outer sep=0pt, scale=  1.00] at ( 37.20,245.41) {0.3};

\node[rotate= 90.00,color=drawColor,anchor=base,inner sep=0pt, outer sep=0pt, scale=  1.00] at ( 37.20,303.71) {0.4};

\draw[color=drawColor,line cap=round,line join=round,fill opacity=0.00,] ( 49.20, 61.20) --
	(336.15, 61.20) --
	(336.15,312.15) --
	( 49.20,312.15) --
	( 49.20, 61.20);
\end{scope}
\begin{scope}
\path[clip] (  0.00,  0.00) rectangle (361.35,361.35);
\definecolor[named]{drawColor}{rgb}{0.25,0.33,0.33}
\definecolor[named]{fillColor}{rgb}{0.00,0.85,0.14}
\definecolor[named]{drawColor}{rgb}{0.00,0.00,0.00}

\node[color=drawColor,anchor=base,inner sep=0pt, outer sep=0pt, scale=  1.00] at (192.68, 13.20) {$x$};

\node[rotate= 90.00,color=drawColor,anchor=base,inner sep=0pt, outer sep=0pt, scale=  1.00] at ( 13.20,186.67) {$p(x)$};
\end{scope}
\begin{scope}
\path[clip] ( 49.20, 61.20) rectangle (336.15,312.15);
\definecolor[named]{drawColor}{rgb}{0.25,0.33,0.33}
\definecolor[named]{fillColor}{rgb}{0.00,0.85,0.14}
\definecolor[named]{drawColor}{rgb}{0.00,0.00,0.00}
\definecolor[named]{fillColor}{rgb}{1.00,1.00,1.00}

\draw[color=drawColor,line cap=round,line join=round,] (133.63,101.97) --
	(137.70,101.97) --
	(137.70,111.57) --
	(141.78,111.57) --
	(141.78,123.10) --
	(145.85,123.10) --
	(145.85,136.60) --
	(149.92,136.60) --
	(149.92,151.99) --
	(153.99,151.99) --
	(153.99,169.06) --
	(158.06,169.06) --
	(158.06,187.48) --
	(162.14,187.48) --
	(162.14,206.71) --
	(166.21,206.71) --
	(166.21,226.11) --
	(170.28,226.11) --
	(170.28,244.93) --
	(174.35,244.93) --
	(174.35,262.34) --
	(178.42,262.34) --
	(178.42,277.51) --
	(182.50,277.51) --
	(182.50,289.67) --
	(186.57,289.67) --
	(186.57,298.17) --
	(190.64,298.17) --
	(190.64,302.54) --
	(194.71,302.54) --
	(194.71,302.54) --
	(198.78,302.54) --
	(198.78,298.17) --
	(202.85,298.17) --
	(202.85,289.67) --
	(206.93,289.67) --
	(206.93,277.51) --
	(211.00,277.51) --
	(211.00,262.34) --
	(215.07,262.34) --
	(215.07,244.93) --
	(219.14,244.93) --
	(219.14,226.11) --
	(223.21,226.11) --
	(223.21,206.71) --
	(227.29,206.71) --
	(227.29,187.48) --
	(231.36,187.48) --
	(231.36,169.06) --
	(235.43,169.06) --
	(235.43,151.99) --
	(239.50,151.99) --
	(239.50,136.60) --
	(243.57,136.60) --
	(243.57,123.10) --
	(247.65,123.10) --
	(247.65,111.57) --
	(251.72,111.57) --
	(251.72,101.97);

\draw[color=drawColor,line cap=round,line join=round,] (133.63, 70.49) --
	(251.72, 70.49);

\draw[color=drawColor,line cap=round,line join=round,fill=fillColor,] (133.63, 70.49) -- (133.63,101.97);

\draw[color=drawColor,line cap=round,line join=round,fill=fillColor,] (137.70, 70.49) -- (137.70,111.57);

\draw[color=drawColor,line cap=round,line join=round,fill=fillColor,] (141.78, 70.49) -- (141.78,123.10);

\draw[color=drawColor,line cap=round,line join=round,fill=fillColor,] (145.85, 70.49) -- (145.85,136.60);

\draw[color=drawColor,line cap=round,line join=round,fill=fillColor,] (149.92, 70.49) -- (149.92,151.99);

\draw[color=drawColor,line cap=round,line join=round,fill=fillColor,] (153.99, 70.49) -- (153.99,169.06);

\draw[color=drawColor,line cap=round,line join=round,fill=fillColor,] (158.06, 70.49) -- (158.06,187.48);

\draw[color=drawColor,line cap=round,line join=round,fill=fillColor,] (162.14, 70.49) -- (162.14,206.71);

\draw[color=drawColor,line cap=round,line join=round,fill=fillColor,] (166.21, 70.49) -- (166.21,226.11);

\draw[color=drawColor,line cap=round,line join=round,fill=fillColor,] (170.28, 70.49) -- (170.28,244.93);

\draw[color=drawColor,line cap=round,line join=round,fill=fillColor,] (174.35, 70.49) -- (174.35,262.34);

\draw[color=drawColor,line cap=round,line join=round,fill=fillColor,] (178.42, 70.49) -- (178.42,277.51);

\draw[color=drawColor,line cap=round,line join=round,fill=fillColor,] (182.50, 70.49) -- (182.50,289.67);

\draw[color=drawColor,line cap=round,line join=round,fill=fillColor,] (186.57, 70.49) -- (186.57,298.17);

\draw[color=drawColor,line cap=round,line join=round,fill=fillColor,] (190.64, 70.49) -- (190.64,302.54);

\draw[color=drawColor,line cap=round,line join=round,fill=fillColor,] (194.71, 70.49) -- (194.71,302.54);

\draw[color=drawColor,line cap=round,line join=round,fill=fillColor,] (198.78, 70.49) -- (198.78,298.17);

\draw[color=drawColor,line cap=round,line join=round,fill=fillColor,] (202.85, 70.49) -- (202.85,289.67);

\draw[color=drawColor,line cap=round,line join=round,fill=fillColor,] (206.93, 70.49) -- (206.93,277.51);

\draw[color=drawColor,line cap=round,line join=round,fill=fillColor,] (211.00, 70.49) -- (211.00,262.34);

\draw[color=drawColor,line cap=round,line join=round,fill=fillColor,] (215.07, 70.49) -- (215.07,244.93);

\draw[color=drawColor,line cap=round,line join=round,fill=fillColor,] (219.14, 70.49) -- (219.14,226.11);

\draw[color=drawColor,line cap=round,line join=round,fill=fillColor,] (223.21, 70.49) -- (223.21,206.71);

\draw[color=drawColor,line cap=round,line join=round,fill=fillColor,] (227.29, 70.49) -- (227.29,187.48);

\draw[color=drawColor,line cap=round,line join=round,fill=fillColor,] (231.36, 70.49) -- (231.36,169.06);

\draw[color=drawColor,line cap=round,line join=round,fill=fillColor,] (235.43, 70.49) -- (235.43,151.99);

\draw[color=drawColor,line cap=round,line join=round,fill=fillColor,] (239.50, 70.49) -- (239.50,136.60);

\draw[color=drawColor,line cap=round,line join=round,fill=fillColor,] (243.57, 70.49) -- (243.57,123.10);

\draw[color=drawColor,line cap=round,line join=round,fill=fillColor,] (247.65, 70.49) -- (247.65,111.57);

\draw[color=drawColor,line cap=round,line join=round,fill=fillColor,] (251.72, 70.49) -- (251.72,101.97);
\end{scope}
\begin{scope}
\path[clip] (  0.00,  0.00) rectangle (361.35,361.35);
\definecolor[named]{drawColor}{rgb}{0.25,0.33,0.33}
\definecolor[named]{fillColor}{rgb}{0.00,0.85,0.14}
\definecolor[named]{drawColor}{rgb}{0.00,0.00,0.00}

\node[color=drawColor,anchor=base,inner sep=0pt, outer sep=0pt, scale=  1.20] at (192.68,332.61) {\bfseries $p(x)=\frac{1}{\sqrt{2\pi}}e^{-\frac{x^2}{2}}$};
\end{scope}
\begin{scope}
\path[clip] ( 49.20, 61.20) rectangle (336.15,312.15);
\definecolor[named]{drawColor}{rgb}{0.25,0.33,0.33}
\definecolor[named]{fillColor}{rgb}{0.00,0.85,0.14}
\definecolor[named]{drawColor}{rgb}{0.00,0.00,0.00}

\node[color=drawColor,anchor=base,inner sep=0pt, outer sep=0pt, scale=  1.00] at (275.34,242.91) {\small$\displaystyle\int_{-2}^{2}p(x)dx\approx0.954$};
\end{scope}
\end{tikzpicture}

% Created by tikzDevice
\begin{tikzpicture}[x=1pt,y=1pt]
\draw[color=white,opacity=0] (0,0) rectangle (361.35,361.35);
\begin{scope}
\path[clip] (  0.00,  0.00) rectangle (361.35,361.35);
\definecolor[named]{drawColor}{rgb}{0.25,0.33,0.33}
\definecolor[named]{fillColor}{rgb}{0.00,0.45,0.37}
\definecolor[named]{drawColor}{rgb}{0.00,0.00,0.00}
\definecolor[named]{fillColor}{rgb}{1.00,1.00,1.00}

\draw[color=drawColor,line cap=round,line join=round,fill=fillColor,] ( 85.85, 61.20) -- (333.27, 61.20);

\draw[color=drawColor,line cap=round,line join=round,fill=fillColor,] ( 85.85, 61.20) -- ( 85.85, 55.20);

\draw[color=drawColor,line cap=round,line join=round,fill=fillColor,] (147.71, 61.20) -- (147.71, 55.20);

\draw[color=drawColor,line cap=round,line join=round,fill=fillColor,] (209.56, 61.20) -- (209.56, 55.20);

\draw[color=drawColor,line cap=round,line join=round,fill=fillColor,] (271.42, 61.20) -- (271.42, 55.20);

\draw[color=drawColor,line cap=round,line join=round,fill=fillColor,] (333.27, 61.20) -- (333.27, 55.20);

\node[color=drawColor,anchor=base,inner sep=0pt, outer sep=0pt, scale=  1.00] at ( 85.85, 37.20) {2};

\node[color=drawColor,anchor=base,inner sep=0pt, outer sep=0pt, scale=  1.00] at (147.71, 37.20) {4};

\node[color=drawColor,anchor=base,inner sep=0pt, outer sep=0pt, scale=  1.00] at (209.56, 37.20) {6};

\node[color=drawColor,anchor=base,inner sep=0pt, outer sep=0pt, scale=  1.00] at (271.42, 37.20) {8};

\node[color=drawColor,anchor=base,inner sep=0pt, outer sep=0pt, scale=  1.00] at (333.27, 37.20) {10};

\draw[color=drawColor,line cap=round,line join=round,fill=fillColor,] ( 49.20, 63.12) -- ( 49.20,305.58);

\draw[color=drawColor,line cap=round,line join=round,fill=fillColor,] ( 49.20, 63.12) -- ( 43.20, 63.12);

\draw[color=drawColor,line cap=round,line join=round,fill=fillColor,] ( 49.20,111.62) -- ( 43.20,111.62);

\draw[color=drawColor,line cap=round,line join=round,fill=fillColor,] ( 49.20,160.11) -- ( 43.20,160.11);

\draw[color=drawColor,line cap=round,line join=round,fill=fillColor,] ( 49.20,208.60) -- ( 43.20,208.60);

\draw[color=drawColor,line cap=round,line join=round,fill=fillColor,] ( 49.20,257.09) -- ( 43.20,257.09);

\draw[color=drawColor,line cap=round,line join=round,fill=fillColor,] ( 49.20,305.58) -- ( 43.20,305.58);

\node[rotate= 90.00,color=drawColor,anchor=base,inner sep=0pt, outer sep=0pt, scale=  1.00] at ( 37.20, 63.12) {0};

\node[rotate= 90.00,color=drawColor,anchor=base,inner sep=0pt, outer sep=0pt, scale=  1.00] at ( 37.20,111.62) {2};

\node[rotate= 90.00,color=drawColor,anchor=base,inner sep=0pt, outer sep=0pt, scale=  1.00] at ( 37.20,160.11) {4};

\node[rotate= 90.00,color=drawColor,anchor=base,inner sep=0pt, outer sep=0pt, scale=  1.00] at ( 37.20,208.60) {6};

\node[rotate= 90.00,color=drawColor,anchor=base,inner sep=0pt, outer sep=0pt, scale=  1.00] at ( 37.20,257.09) {8};

\node[rotate= 90.00,color=drawColor,anchor=base,inner sep=0pt, outer sep=0pt, scale=  1.00] at ( 37.20,305.58) {10};

\draw[color=drawColor,line cap=round,line join=round,fill opacity=0.00,] ( 49.20, 61.20) --
	(336.15, 61.20) --
	(336.15,312.15) --
	( 49.20,312.15) --
	( 49.20, 61.20);
\end{scope}
\begin{scope}
\path[clip] (  0.00,  0.00) rectangle (361.35,361.35);
\definecolor[named]{drawColor}{rgb}{0.25,0.33,0.33}
\definecolor[named]{fillColor}{rgb}{0.00,0.45,0.37}
\end{scope}
\begin{scope}
\path[clip] (  0.00,  0.00) rectangle (361.35,361.35);
\definecolor[named]{drawColor}{rgb}{0.25,0.33,0.33}
\definecolor[named]{fillColor}{rgb}{0.00,0.45,0.37}
\definecolor[named]{drawColor}{rgb}{0.00,0.00,0.00}

\draw[color=drawColor,line cap=round,line join=round,fill opacity=0.00,] ( 49.20, 61.20) --
	(336.15, 61.20) --
	(336.15,312.15) --
	( 49.20,312.15) --
	( 49.20, 61.20);
\end{scope}
\begin{scope}
\path[clip] ( 49.20, 61.20) rectangle (336.15,312.15);
\definecolor[named]{drawColor}{rgb}{0.25,0.33,0.33}
\definecolor[named]{fillColor}{rgb}{0.00,0.45,0.37}
\definecolor[named]{drawColor}{rgb}{0.00,0.00,0.00}
\definecolor[named]{fillColor}{rgb}{1.00,1.00,1.00}

\draw[color=drawColor,line cap=round,line join=round,fill=fillColor,] ( 49.20, 85.48) -- (336.15,298.11);

\node[color=drawColor,anchor=base,inner sep=0pt, outer sep=0pt, scale=  1.00] at (313.38,267.41) {\color[rgb]{0.95,0.37,0.61}{$\alpha$}};

\node[color=drawColor,anchor=base,inner sep=0pt, outer sep=0pt, scale=  1.00] at (255.89,220.10) {\color[rgb]{0.25,0.19,0.96}{$\theta$}};

\node[color=drawColor,anchor=base,inner sep=0pt, outer sep=0pt, scale=  1.00] at (157.64,156.70) {\color[rgb]{0.01,0.59,0.86}{$\tau$}};

\node[color=drawColor,anchor=base,inner sep=0pt, outer sep=0pt, scale=  1.00] at (252.20,252.52) {\color[rgb]{0.06,0.97,0.59}{$\beta$}};

\node[color=drawColor,anchor=base,inner sep=0pt, outer sep=0pt, scale=  1.00] at (266.05,264.91) {\color[rgb]{0.58,0.68,0.27}{$\vartheta$}};

\node[color=drawColor,anchor=base,inner sep=0pt, outer sep=0pt, scale=  1.00] at (201.46,183.96) {\color[rgb]{0.06,0.22,0.92}{$\pi$}};

\node[color=drawColor,anchor=base,inner sep=0pt, outer sep=0pt, scale=  1.00] at (114.32,104.15) {\color[rgb]{0.5,1,0.97}{$\upsilon$}};

\node[color=drawColor,anchor=base,inner sep=0pt, outer sep=0pt, scale=  1.00] at (221.03,221.07) {\color[rgb]{0.53,0.27,0.52}{$\gamma$}};

\node[color=drawColor,anchor=base,inner sep=0pt, outer sep=0pt, scale=  1.00] at (122.68,113.28) {\color[rgb]{0.05,0.76,0.18}{$\varpi$}};

\node[color=drawColor,anchor=base,inner sep=0pt, outer sep=0pt, scale=  1.00] at (234.76,237.56) {\color[rgb]{0.38,0.06,0.67}{$\phi$}};

\node[color=drawColor,anchor=base,inner sep=0pt, outer sep=0pt, scale=  1.00] at (127.78,162.08) {\color[rgb]{0.64,0.74,0.08}{$\delta$}};

\node[color=drawColor,anchor=base,inner sep=0pt, outer sep=0pt, scale=  1.00] at (103.11,170.94) {\color[rgb]{0.17,0.29,0.42}{$\kappa$}};

\node[color=drawColor,anchor=base,inner sep=0pt, outer sep=0pt, scale=  1.00] at (133.93,173.30) {\color[rgb]{0.99,0.46,0.23}{$\rho$}};

\node[color=drawColor,anchor=base,inner sep=0pt, outer sep=0pt, scale=  1.00] at (283.10,299.61) {\color[rgb]{0.12,0.46,0.19}{$\varphi$}};

\node[color=drawColor,anchor=base,inner sep=0pt, outer sep=0pt, scale=  1.00] at ( 92.76,101.27) {\color[rgb]{0.07,0.1,0.6}{$\epsilon$}};

\node[color=drawColor,anchor=base,inner sep=0pt, outer sep=0pt, scale=  1.00] at ( 78.61,141.67) {\color[rgb]{0.71,0.99,0.15}{$\lambda$}};

\node[color=drawColor,anchor=base,inner sep=0pt, outer sep=0pt, scale=  1.00] at (205.33,206.44) {\color[rgb]{0.75,0.45,1}{$\varrho$}};

\node[color=drawColor,anchor=base,inner sep=0pt, outer sep=0pt, scale=  1.00] at (323.48,296.47) {\color[rgb]{0.99,0.43,0.85}{$\chi$}};

\node[color=drawColor,anchor=base,inner sep=0pt, outer sep=0pt, scale=  1.00] at (160.05,190.05) {\color[rgb]{0.71,0.39,0.84}{$\varepsilon$}};

\node[color=drawColor,anchor=base,inner sep=0pt, outer sep=0pt, scale=  1.00] at (130.35,147.26) {\color[rgb]{0.23,0.3,0.81}{$\mu$}};

\node[color=drawColor,anchor=base,inner sep=0pt, outer sep=0pt, scale=  1.00] at ( 93.34,129.54) {\color[rgb]{0.63,0.91,0.6}{$\sigma$}};

\node[color=drawColor,anchor=base,inner sep=0pt, outer sep=0pt, scale=  1.00] at ( 63.09, 94.68) {\color[rgb]{0.73,0.06,0.34}{$\psi$}};

\node[color=drawColor,anchor=base,inner sep=0pt, outer sep=0pt, scale=  1.00] at (170.12,136.63) {\color[rgb]{0.83,0.34,0.23}{$\zeta$}};

\node[color=drawColor,anchor=base,inner sep=0pt, outer sep=0pt, scale=  1.00] at (104.12,117.92) {\color[rgb]{0.76,0.91,0.79}{$\nu$}};

\node[color=drawColor,anchor=base,inner sep=0pt, outer sep=0pt, scale=  1.00] at (156.42,159.32) {\color[rgb]{0.58,0.62,0.1}{$\varsigma$}};

\node[color=drawColor,anchor=base,inner sep=0pt, outer sep=0pt, scale=  1.00] at (311.05,242.53) {\color[rgb]{0.87,0.23,0.31}{$\omega$}};

\node[color=drawColor,anchor=base,inner sep=0pt, outer sep=0pt, scale=  1.00] at (119.32, 68.00) {\color[rgb]{0.32,0.25,0.91}{$\eta$}};

\node[color=drawColor,anchor=base,inner sep=0pt, outer sep=0pt, scale=  1.00] at (290.27,276.96) {\color[rgb]{0.52,0.55,0.81}{$\xi$}};

\node[color=drawColor,anchor=base,inner sep=0pt, outer sep=0pt, scale=  1.00] at (272.69,240.80) {\color[rgb]{0.95,0.47,0.77}{$\Gamma$}};

\node[color=drawColor,anchor=base,inner sep=0pt, outer sep=0pt, scale=  1.00] at (323.86,259.35) {\color[rgb]{0.19,0.33,0.29}{$\Lambda$}};

\node[color=drawColor,anchor=base,inner sep=0pt, outer sep=0pt, scale=  1.00] at (316.84,300.36) {\color[rgb]{0.83,0.19,0.85}{$\Sigma$}};

\node[color=drawColor,anchor=base,inner sep=0pt, outer sep=0pt, scale=  1.00] at (212.44,219.81) {\color[rgb]{0.63,0.72,1}{$\Psi$}};

\node[color=drawColor,anchor=base,inner sep=0pt, outer sep=0pt, scale=  1.00] at ( 62.80, 73.28) {\color[rgb]{0.84,0.27,0.45}{$\Delta$}};

\node[color=drawColor,anchor=base,inner sep=0pt, outer sep=0pt, scale=  1.00] at (122.08,115.12) {\color[rgb]{0.61,0.99,0.51}{$\Xi$}};

\node[color=drawColor,anchor=base,inner sep=0pt, outer sep=0pt, scale=  1.00] at (282.69,260.19) {\color[rgb]{0.29,0.38,0.47}{$\Upsilon$}};

\node[color=drawColor,anchor=base,inner sep=0pt, outer sep=0pt, scale=  1.00] at (325.52,278.19) {\color[rgb]{0.82,0.34,0.77}{$\Omega$}};

\node[color=drawColor,anchor=base,inner sep=0pt, outer sep=0pt, scale=  1.00] at (305.39,265.82) {\color[rgb]{0.89,0.59,0.1}{$\Theta$}};

\node[color=drawColor,anchor=base,inner sep=0pt, outer sep=0pt, scale=  1.00] at ( 59.83,107.32) {\color[rgb]{0.83,0.57,0.68}{$\Pi$}};

\node[color=drawColor,anchor=base,inner sep=0pt, outer sep=0pt, scale=  1.00] at (221.53,206.66) {\color[rgb]{0.57,0.62,0.94}{$\Phi$}};

\node[color=drawColor,anchor=base,inner sep=0pt, outer sep=0pt, scale=  1.00] at (269.87,257.47) {\color[rgb]{0.95,0.37,0.61}{$\alpha$}};

\node[color=drawColor,anchor=base,inner sep=0pt, outer sep=0pt, scale=  1.00] at ( 61.81, 85.84) {\color[rgb]{0.25,0.19,0.96}{$\theta$}};

\node[color=drawColor,anchor=base,inner sep=0pt, outer sep=0pt, scale=  1.00] at (185.41,177.77) {\color[rgb]{0.01,0.59,0.86}{$\tau$}};

\node[color=drawColor,anchor=base,inner sep=0pt, outer sep=0pt, scale=  1.00] at (133.01,153.08) {\color[rgb]{0.06,0.97,0.59}{$\beta$}};

\node[color=drawColor,anchor=base,inner sep=0pt, outer sep=0pt, scale=  1.00] at (174.84,173.93) {\color[rgb]{0.58,0.68,0.27}{$\vartheta$}};

\node[color=drawColor,anchor=base,inner sep=0pt, outer sep=0pt, scale=  1.00] at (255.59,237.04) {\color[rgb]{0.06,0.22,0.92}{$\pi$}};

\node[color=drawColor,anchor=base,inner sep=0pt, outer sep=0pt, scale=  1.00] at (259.43,237.55) {\color[rgb]{0.5,1,0.97}{$\upsilon$}};

\node[color=drawColor,anchor=base,inner sep=0pt, outer sep=0pt, scale=  1.00] at (299.47,266.64) {\color[rgb]{0.53,0.27,0.52}{$\gamma$}};

\node[color=drawColor,anchor=base,inner sep=0pt, outer sep=0pt, scale=  1.00] at (144.59,152.66) {\color[rgb]{0.05,0.76,0.18}{$\varpi$}};

\node[color=drawColor,anchor=base,inner sep=0pt, outer sep=0pt, scale=  1.00] at (253.93,215.44) {\color[rgb]{0.38,0.06,0.67}{$\phi$}};

\node[color=drawColor,anchor=base,inner sep=0pt, outer sep=0pt, scale=  1.00] at (240.93,219.40) {\color[rgb]{0.64,0.74,0.08}{$\delta$}};
\end{scope}
\begin{scope}
\path[clip] (  0.00,  0.00) rectangle (361.35,361.35);
\definecolor[named]{drawColor}{rgb}{0.25,0.33,0.33}
\definecolor[named]{fillColor}{rgb}{0.00,0.45,0.37}
\definecolor[named]{drawColor}{rgb}{0.00,0.00,0.00}

\node[color=drawColor,anchor=base,inner sep=0pt, outer sep=0pt, scale=  1.00] at (192.67,318.15) {Linear model: $R^{2}= 0.8983 $};
\end{scope}
\begin{scope}
\path[clip] ( 49.20, 61.20) rectangle (336.15,312.15);
\definecolor[named]{drawColor}{rgb}{0.25,0.33,0.33}
\definecolor[named]{fillColor}{rgb}{0.00,0.45,0.37}
\definecolor[named]{drawColor}{rgb}{0.00,0.00,0.00}

\node[color=drawColor,anchor=base west,inner sep=0pt, outer sep=0pt, scale=  1.00] at (249.56, 69.76) {$y = 0.945x +0.152$};
\end{scope}
\end{tikzpicture}

\end{document}
Click to download: tikzdevice-demo.tex • tikzdevice-demo.pdf
Open in Overleaf: tikzdevice-demo.tex