


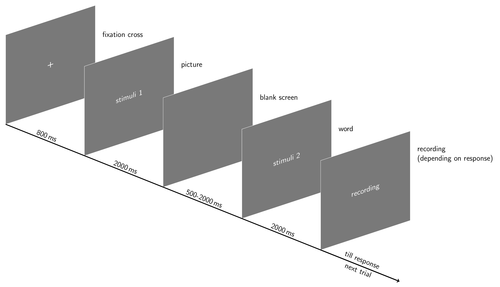
A diagram depicting time course of events in an experiment. Every frame represents a screen presented to a participant. This kind of diagram is mostly used in (cognitive) psychology and neuroscience.
Edit and compile if you like:
% Time course of events in an experiment
% Author: Rudolf Siegel
\documentclass[tikz,border=10pt]{standalone}
\usetikzlibrary{positioning}
\begin{document}
\begin{tikzpicture}
  \tikzset{
        basefont/.style = {font = \Large\sffamily},
          timing/.style = {basefont, sloped,above,},
           label/.style = {basefont, align = left},
          screen/.style = {basefont, white, align = center,
                           minimum size = 6cm, fill = black!60, draw = white}};

  % macro for defining screens
  \newcommand*{\screen}[4]{%
    \begin{scope}[xshift  =#3, yshift = #4,
                  every node/.append style = {yslant = 0.33},
                  yslant = 0.33,
                  local bounding box = #1]
      \node[screen] at (3cm,3cm) {#2};
    \end{scope}
  }
  % define several screens
  \screen{frame1}{\textbf+} {0}     {0}
  \screen{frame2}{stimuli 1}{150} {-60}
  \screen{frame3}{}         {300}{-120}
  \screen{frame4}{stimuli 2}{450}{-180}
  \screen{frame5}{recording}{600}{-240}
  \coordinate [xshift=750,yshift=-300] (frame6);

  % add annotations
  \foreach \i / \content in {
      1/fixation cross,
      2/picture,
      3/blank screen,
      4/word,
      5/recording\\(depending on response)
    }
    \node[label, above right=5em and 1em of frame\i.east]
      (f\i-label) {\content};

  % add time course
  \foreach \j [count=\i] / \content in {
      2/800\,ms,
      3/2000\,ms,
      4/500-2000\,ms,
      5/2000\,ms,
      6/till response
    }
    \path[ultra thick] (frame\i.south west) edge
      node[timing] {\content} (frame\j.south west);

  % some manual addition
  \path[ultra thick,->] (frame5.south west) edge
    node[timing, below] {next trial} (frame6);
\end{tikzpicture}
\end{document}
Click to download: events.tex • events.pdf
Open in Overleaf: events.tex