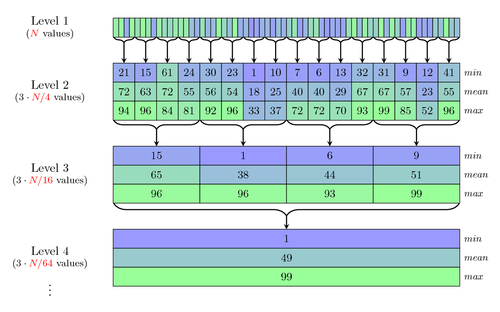
This diagram shows a decimation process in a database. The first level shows random samples, and subsequent levels calculate the min, mean, and max of groups of four entries from each previous level.
All of the math, including the random number generation, is done directly in TikZ. Since the actual numbers didn't matter, we could choose a random seed that made the result look best.
This code was written by Jim Paris and published on TeX.SE.

Edit and compile if you like:
% Database decimation process
% Author: Jim Paris
\documentclass{article}
\usepackage{tikz}
\usepackage[active,tightpage]{preview}
\PreviewEnvironment{tikzpicture}
\setlength\PreviewBorder{10pt}%
\usepackage{xcolor}
\usepackage{etoolbox}

\usetikzlibrary{decorations}
\usetikzlibrary{decorations.pathreplacing}
\usetikzlibrary{calc}
\usetikzlibrary{arrows}

\newtoggle{quickdecim}
%\toggletrue{quickdecim} % Uncomment this to render more quickly (non-random)

\begin{document}
\begin{tikzpicture}
  \def\levels{4} % 2, 3, or 4
  \pgfmathtruncatemacro{\blocks}{4^(\levels-1)}
  \def\maxrand{99}
  \def\xoffset{1.1}
  \def\yoffset{2.6}
  \pgfmathsetseed{31337}
  \pgfmathsetmacro{\totalwidth}{10}
  \pgfmathsetmacro{\levelheight}{2.4}
  \pgfmathsetmacro{\sampleheight}{0.55}

  \definecolor{lowcolor} {rgb}{0.6,0.6,1}
  \definecolor{highcolor}{rgb}{0.6,1,0.6}

  \tikzstyle{Sample} = [
    draw, anchor=west,
    inner sep=0,
    outer sep=0,
    minimum height=\sampleheight * 1cm,
    font=\small,
    text=black,
  ]

  % make random numbers
  \pgfmathtruncatemacro{\runningrandarray}{random(\maxrand)}
  \foreach \x[count=\xi from 1] in {2,...,\blocks} {
    \let\temprand\runningrandarray
    \pgfmathtruncatemacro{\tempres}{random(\maxrand)}
    \xdef\runningrandarray{\temprand,\tempres}
  }
  \xdef\randarray{{\runningrandarray}}

  % boxes
  \foreach \level in {1,...,\levels} {
    \coordinate (level\level sample0) at
    (\xoffset - \totalwidth / 2,
    \yoffset + \levelheight - \levelheight * \level);
    \pgfmathsetmacro{\avgblocks}{4^(\level-1)}
    \pgfmathsetmacro{\levelblocks}{\blocks / \avgblocks}
    \pgfmathsetmacro{\samplewidth}{\totalwidth/\levelblocks}

    \foreach \i in {1,...,\levelblocks} {
      \iftoggle{quickdecim}{
        % can do this instead of using real samples, for speed
        \xdef\smin{5}
        \xdef\smean{50}
        \xdef\smax{95}
      }{
        % calculate sample values from the randarray
        \pgfmathsetmacro{\smin}{100}
        \pgfmathsetmacro{\smax}{0}
        \pgfmathsetmacro{\samplesum}{0}
        \pgfmathsetmacro{\countfrom}{(\i - 1) * \avgblocks}
        \pgfmathsetmacro{\countto}{\countfrom + \avgblocks - 1}
        \foreach \j in {\countfrom,...,\countto} {
          \pgfmathsetmacro{\tmp}{\samplesum + \randarray[\j] / \avgblocks}
          \xdef\samplesum{\tmp}
          \pgfmathtruncatemacro{\tmp}{min(\smin, \randarray[\j])}
          \xdef\smin{\tmp}
          \pgfmathtruncatemacro{\tmp}{max(\smax, \randarray[\j])}
          \xdef\smax{\tmp}
        };
        \pgfmathtruncatemacro{\tmp}{\samplesum}
        \xdef\smean{\tmp}
      }
      \pgfmathtruncatemacro{\cmin}{(\smin - 1) / (\maxrand - 1) * 100}
      \pgfmathtruncatemacro{\cmean}{(\smean - 1) / (\maxrand - 1) * 100}
      \pgfmathtruncatemacro{\cmax}{(\smax - 1) / (\maxrand - 1) * 100}
      \pgfmathtruncatemacro{\prev}{\i-1}

      \ifnumequal{\level}{1}{
        \node[Sample, xshift=\samplewidth * \prev cm, draw,
        yshift=\sampleheight * -2cm,
        minimum width=\samplewidth cm,
        fill=highcolor!\cmean!lowcolor]
        (level\level samplemax\i) at (level\level sample0) {};
        \coordinate (level\level samplemin\i) at (level\level samplemax\i);
        \coordinate (level\level samplemean\i) at (level\level samplemax\i);
      }{
        \node[Sample, xshift=\samplewidth * \prev cm, draw,
        yshift=\sampleheight * 0cm,
        minimum width=\samplewidth cm,
        fill=highcolor!\cmin!lowcolor]
        (level\level samplemin\i) at (level\level sample0) {\smin};

        \node[Sample, xshift=\samplewidth * \prev cm, draw,
        yshift=\sampleheight * -1cm,
        minimum width=\samplewidth cm,
        fill=highcolor!\cmean!lowcolor]
        (level\level samplemean\i) at (level\level sample0) {\smean};

        \node[Sample, xshift=\samplewidth * \prev cm, draw,
        yshift=\sampleheight * -2cm,
        minimum width=\samplewidth cm,
        fill=highcolor!\cmax!lowcolor]
        (level\level samplemax\i) at (level\level sample0) {\smax};
      }
    };

    \coordinate (level\level sampleminlabel)
    at (level\level samplemin\levelblocks);
    \coordinate (level\level samplemeanlabel)
    at (level\level samplemean\levelblocks);
    \coordinate (level\level samplemaxlabel)
    at (level\level samplemax\levelblocks);
  };

  % arrows
  \foreach \next in {2,...,\levels} {
    \pgfmathtruncatemacro{\level}{\next-1}
    \pgfmathsetmacro{\amplitude}{3pt * \level + 1.5pt}
    \pgfmathsetmacro{\thislevelblocks}{\blocks / (4^(\level-1))}
    \pgfmathsetmacro{\nextlevelblocks}{\blocks / (4^(\level))}
    \foreach \block in {1,...,\nextlevelblocks} {
      \pgfmathtruncatemacro{\a}{4*(\block-1)+1}
      \pgfmathtruncatemacro{\b}{4*(\block-1)+4}
      \pgfmathtruncatemacro{\c}{4*(\block-1)+2}
      \draw [thick, decorate, decoration={brace, amplitude=\amplitude, mirror}]
      ([xshift=0.5pt]level\level samplemax\a.south west) --
      ([xshift=-0.5pt]level\level samplemax\b.south east);
      \draw[thick, -stealth]
      ([yshift=-\amplitude]level\level samplemax\c.south east) --
      (level\next samplemin\block .north);
    };
  };

  % text
  \foreach \level in {1,...,\levels} {
    \pgfmathtruncatemacro{\decim}{(4^(\level - 1))}
    % Level N
    \node[xshift=-2.5cm, yshift=6pt, anchor=west] (foo) at
    ($(level\level sample0 |- level\level samplemean1)$)
    {Level \level};
    % Samples
    \node[anchor=north, inner sep=0, font=\footnotesize] at (foo.south)
    {\ifnumequal{\level}{1}{(${\color{red}N}$ values)}
      {($3\cdot {\color{red}N / \decim}$ values)}};
  };

  \begin{scope}[anchor=west, inner sep=0, font=\footnotesize\itshape,
    text depth=0ex, text height=1.1ex, draw]
    \foreach \level in {2,...,\levels} {
      \node[xshift=3pt] at (level\level sampleminlabel) { min };
      \node[xshift=3pt] at (level\level samplemeanlabel) { mean };
      \node[xshift=3pt] at (level\level samplemaxlabel) { max };
    };
  \end{scope}

  \node[yshift=-0.8cm] at (foo.south) { $\vdots$ };

\end{tikzpicture}
\end{document}
Click to download: database-decimation-process.tex • database-decimation-process.pdf
Open in Overleaf: database-decimation-process.tex


