")


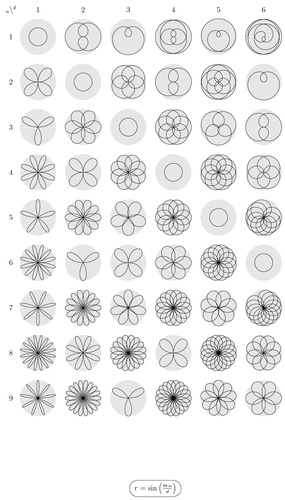
An example for creating plots with foreach and pgfpointxy. It solves an equation for the parameters d from 1 to 6 an n from 1 to 9. There is still a bug in the formula which only strikes when \d > 5. Increasing the number \n from 9 to 10 runs MiKTeX out of memory.
Edit and compile if you like:
% Rose rhodonea curve
% Author: Manuel Kirsch
\documentclass [12pt]{scrartcl}
\usepackage{tikz}
\usepackage[active,tightpage]{preview}
\PreviewEnvironment{tikzpicture}
\setlength\PreviewBorder{5pt}%


\usetikzlibrary{shapes}

\title{Rose-rhodonea-curve}
\author{Manuel Kirsch}
\begin{document}
\thispagestyle{empty}
\begin{tikzpicture}
    \draw (-1, 1) node{$_n\backslash^d$};
    \foreach \d in {1, 2, ..., 6} {
        \draw (2.5 * \d - 2, 1) node{\d};
    }
    \foreach \n in {1, 2, ..., 9} {
    \draw (-1, -2.5 * \n + 2) node{\n};
        \foreach \d in {1, 2, ..., 6} {
            \fill[black!10!white] (2.5 * \d - 2, -2.5 * \n + 2) circle (1cm);
    \ifnum\n=\d
        \draw (2.5 * \d - 2, -2.5 * \n + 2) circle (0.5cm);
    \else
        \pgfplothandlerlineto
        \pgfplotfunction{\x}{0, \d, ..., 180\d}{
            \pgfpointxy
            {2.5 * \d + cos(\x) * sin(\n / \d * \x) - 2}
            {-2.5 * \n + sin(\x) * sin(\n / \d * \x) + 2}
        }
    \pgfusepath{stroke}
    \fi
        }
    }
    \draw (7,-25.5) node [rounded rectangle, draw]
        {$r = \sin\left(\frac{\Theta \cdot n}{d}\right)$};
\end{tikzpicture}
\end{document}
Click to download: rose-rhodonea-curve.tex • rose-rhodonea-curve.pdf
Open in Overleaf: rose-rhodonea-curve.tex