")


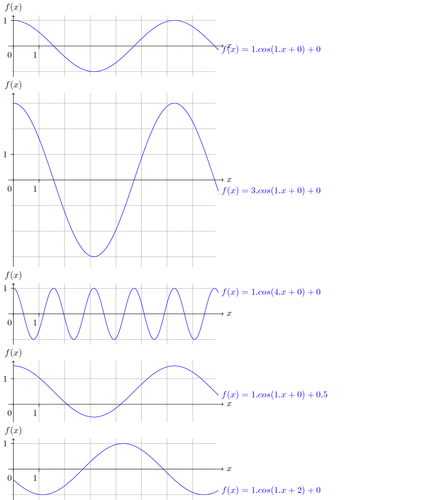
As a math teacher, I have to explain how parameters affect the graph of a function. By putting the "tikzpicture" inside a LaTeX macro, it is very easy and fast to create multiple graphs by modifying only the parameters and calling the macro.
Edit and compile if you like:
% under Creative Commons attribution license.
% A work by Yves Delhaye
% Requires GNUPLOT and shell-escape enabled
\documentclass{minimal}

\usepackage{tikz}
\usepackage[active,tightpage]{preview}
\setlength\PreviewBorder{0pt}%

\usetikzlibrary{arrows,shapes}
\usepackage{xifthen}

\begin{document}

% Macros for cst. They have to be redefined each time. See inside document
\newcommand{\cA}{1}%	Cste . fct
\newcommand{\cB}{0}%	Cste + fct
\newcommand{\cC}{1}%	Cste . var
\newcommand{\cD}{0}%	Cste + var

%LaTeX Macro for drawing fct with pgf/tikz. Define once, use many!
\newcommand{\FctAss}{
\begin{tikzpicture}[domain=0:8]
  \pgfmathparse{0.1+\cA*1.1 +\cB} \pgfmathresult \let\maxY\pgfmathresult% evaluate maxY
  \pgfmathparse{-0.1-\cA*1.1 +\cB} \pgfmathresult \let\minY\pgfmathresult% evaluate minY
     \pgfmathparse{\maxY < 1} \pgfmathresult \let\BmaxY\pgfmathresult% What if maxY < 1? Then set Boolean to 1
       \ifthenelse{\equal{\BmaxY}{1.0}}{%
       \pgfmathparse{1.2} \pgfmathresult \let\maxY\pgfmathresult% Correct maxY to have correct graph
       }{}
     \pgfmathparse{\minY > 0} \pgfmathresult \let\BminY\pgfmathresult% What if minY > 0? Then set Boolean to 1
       \ifthenelse{\equal{\BminY}{1.0}}{%
       \pgfmathparse{0} \pgfmathresult \let\minY\pgfmathresult% Correct minY to have correct graph
       }{}
%        DRAW the graph of the function from here on
   \draw[very thin,color=gray] (-0.1,\minY) grid (7.9,\maxY);% GRID use minY & maxY
    \draw[->] (-0.2,0) -- (8.2,0) node[right] {$x$};
    \draw[->] (0,\minY) -- (0,\maxY) node[above] {$f(x)$};% y axis use minY & maxY too
    \draw[smooth,samples=200,color=blue] plot function{(\cA)* (cos((\cC)*x+(\cD))) + \cB}
        node[right] {$f(x) = \cA{} . cos(\cC{} . x + \cD{}) + \cB{}$};
% units for cartesian reference frame
    \foreach \x in {0,1}
        \draw (\x cm,1pt) -- (\x cm,-3pt)
            node[anchor=north,xshift=-0.15cm] {$\x$};
    \foreach \y/\ytext in {1}
        \draw (1pt,\y cm) -- (-3pt,\y cm) node[anchor=east] {$\ytext$};
\end{tikzpicture}
}
% END of macro
\begin{preview}
% And now use it!
    \FctAss{}

% Change the parameters
    \renewcommand{\cA}{3}
    \renewcommand{\cB}{0}
    \renewcommand{\cC}{1}
    \renewcommand{\cD}{0}
% WITHOUT rewriting the code for the picture
    \FctAss{}
%
% And do it again
    \renewcommand{\cA}{1}
    \renewcommand{\cB}{0}
    \renewcommand{\cC}{4}
    \renewcommand{\cD}{0}

    \FctAss{}

% And again
    \renewcommand{\cA}{1}
    \renewcommand{\cB}{0.5}
    \renewcommand{\cC}{1}
    \renewcommand{\cD}{0}

    \FctAss{}

% And again
    \renewcommand{\cA}{1}
    \renewcommand{\cB}{0}
    \renewcommand{\cC}{1}
    \renewcommand{\cD}{2}

    \FctAss{}
\end{preview}
%   UNCOMMENT IF YOU WANT TO SEE MORE
% % This is where the test on maxY is useful.
%     \renewcommand{\cA}{3}
%     \renewcommand{\cB}{-14}
%     \renewcommand{\cC}{2}
%     \renewcommand{\cD}{-2}
%
%     \FctAss{}
%
% % And here the test on minY is useful.
%     \renewcommand{\cA}{3}
%     \renewcommand{\cB}{14}
%     \renewcommand{\cC}{2}
%     \renewcommand{\cD}{-2}
%
%     \FctAss{}
%
\end{document}
Click to download: parameterized-plots.tex • parameterized-plots.pdf
Open in Overleaf: parameterized-plots.tex