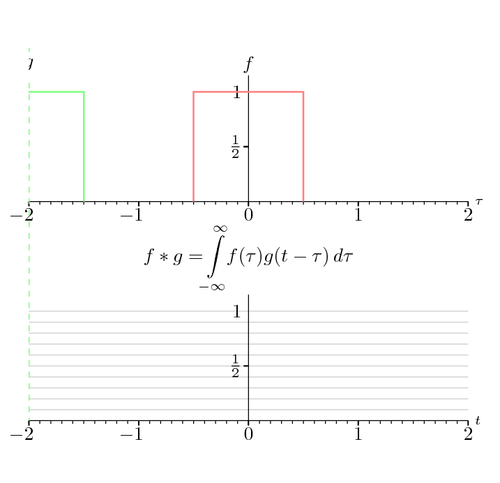
A convolution is an operation on two functions that produces a third function, the result can be thought of as a blending, or weighted average of both functions. The result has various interpretations; this particular example can be seen as the convolution of two block waves, or for example, the convolution of two independent uniform probability density functions; the convolution represents the pdf of the sum.
Frame by frame the value of the convolution is computed; note that f*g is a function of t for every t we draw f(τ), g(t - τ), and the product f(τ)g(t - τ), this drawn in yellow. The area of this product, which can be thought of as ‘overlap’, is the outcome of the integral. The value of t is indicated by the dashed green line. Note however that in the top graph g is drawn as a function of τ for a certain value of t.
For more information, see:

Edit and compile if you like:
% Animated illustration of the convolution of two functions.
% Author: Berteun Damman
%
% A convolution is an operation on two functions that produces a third
% function, the result can be thought of as a blending, or weighted
% average of both functions. The result has various interpretations; this
% particular example can be seen as the convolution of two block waves,
% or for example, the convolution of two independent uniform probability
% density functions; the convolution represents the pdf of their sum.

\documentclass{article}
\usepackage{tikz,animate}

\usepackage[active,tightpage]{preview}
\PreviewEnvironment{animateinline}
\setlength\PreviewBorder{5pt}%


\tikzset{overlap/.style={fill=yellow!30},
    block wave/.style={thick},
    function f/.style={block wave, red!50},
    function g/.style={block wave, green!50},
    convolution/.style={block wave, blue!50},
    function g position/.style={function g, dashed, semithick},
    major tick/.style={semithick},
    axis label/.style={anchor=west},
    x tick label/.style={anchor=north, minimum width=7mm},
    y tick label/.style={anchor=east},
}
\pgfkeys{/pgf/number format/.cd,fixed,precision=1}

\pgfdeclarelayer{background}
\pgfdeclarelayer{foreground}
\pgfsetlayers{background,main,foreground}

\begin{document}
    \newcommand{\mainaxis}{
        % Main axis
        \draw (-2, 0) -- (2, 0) (0, 0) -- (0, 1.15);

        % Small tickmarks on the x axis
        \foreach \x in {-2,-1.9,...,2} {
            \draw (\x, 0) -- (\x, -0.8pt);
        }

        % Labels on the $x$ axis; the llap makes the label center on the
        % number without the minus.
        \foreach \x/\label in {-2/\llap{$-$}2,-1/\llap{$-$}1,0/0,1/1,2/2} {
            \node[x tick label] at (\x, 0) {$\label$};
            \draw[major tick] (\x, 0) -- (\x, -1.25pt);
        }

        % Y tick mark.
        \draw[major tick] (-1.25pt,.5) -- (0,.5);

        % Y labels.
        \node[y tick label] at (0,.5) {$\frac{1}{2}$};
        \node[y tick label] at (0,1) {$1$};
    }

    \def\yshift{-2cm} % Shift of the lower axis
    \newcommand{\drawaxes}{
        \mainaxis
        \node[axis label] at (2,0) {$\scriptstyle \tau$};

        % Second axis, where the convultion will be drawn.
        \begin{scope}[yshift=\yshift]
            \foreach \y in {0.1,0.2,...,1.0}
                \draw[black!20] (-2,\y) -- (2,\y);
            \mainaxis
            \node[axis label] at (2,0) {$\scriptstyle t$};
        \end{scope}

        \begin{pgfonlayer}{foreground}
            \node at (0,1.25) {$f$};
            \node[anchor=base] at (0,-.55)
                {$f*g =\!\!\displaystyle\int\limits_{-\infty}^{\infty}
                    \!\!f(\tau)g(t-\tau)\,d\tau$};
        \end{pgfonlayer}

        \draw[major tick] (-1.25pt,.5) -- (0,.5) (-1.25pt,1) -- (0,1);

        % f(\tau) is basically fixed.
        \draw[function f] (-0.5, 0) -- +(0,1) -- +(1,1) -- +(1,0);
        \clip (-2,-2) rectangle (2, 1.75);
    }

    \newcommand{\drawg}[1]{
        \draw[function g] (#1,0) ++(-0.5, 0) -- +(0,1) -- +(1,1) -- +(1,0);
        \draw[function g position] (#1,1.4) -- (#1,\yshift);
        \node[fill=white] at (#1, 1.25) {$g$};

        % We now slightly abuse \ifdim to determine whether
        % there's an overlap.
        \ifdim#1pt>-1pt\ifdim#1pt<1.01pt
            % Draw legend.
            \fill[overlap] (-2,1.51) rectangle +(0.15,0.15);
            % The right side of f overlaps with the left side of g:
            % 'entering'
            \ifdim#1pt<0pt
                \node[anchor=west] at (-1.85, 1.575)
                    {$f(\tau)g(\pgfmathprintnumber{#1} - \tau$)};
                \begin{pgfonlayer}{background}
                    \fill[overlap] (-.5,0) rectangle (#1+.5,1);
                \end{pgfonlayer}
                \draw[convolution] (-1,\yshift) -- (#1, \yshift+1cm+#1 cm);
            \else
                % The left side of f overlaps with the right side of g:
                % 'leaving'
                \node[anchor=west] at (-1.85, 1.575)
                    {$f(\tau)g(\pgfmathprintnumber{#1} - \tau$)};
                \begin{pgfonlayer}{background}
                    \fill[overlap] (#1-.5,0) rectangle (.5,1);
                \end{pgfonlayer}
                \draw[convolution] (-1,\yshift) -- +(1, 1) --
                    (#1,\yshift+1cm-#1 cm);
            \fi
        \else
            % 'g' is completely past 'f', draw the result.
            \draw[convolution] (-1,\yshift) -- +(1,1) -- +(2,0);
        \fi\fi
    }

    \begin{animateinline}[controls,
        autoplay,buttonsize=1.2em,
        buttonbg=0.6:0.6:1,buttonfg=0.2:0.2:1,
        begin={\begin{tikzpicture}[scale=2]\drawaxes},
        end={\end{tikzpicture}}]{8}

        % Generate frames for -2 ... 2
        \xdef\pos{-2}
        \whiledo{\lengthtest{\pos pt < 2.1 pt}}{
            \drawg{\pos}\newframe
            \pgfmathsetmacro{\pos}{\pos + 0.1}
            \xdef\pos{\pos}
        }

        \drawg{\pos}
    \end{animateinline}
\end{document}
Click to download: convolution-of-two-functions.tex • convolution-of-two-functions.pdf
Open in Overleaf: convolution-of-two-functions.tex


