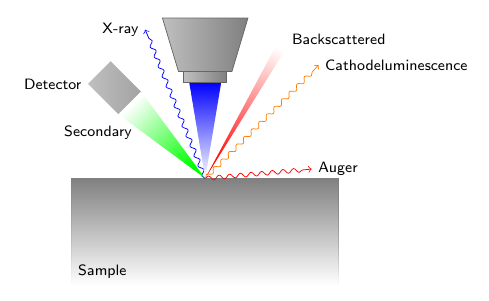
Mechanism of SEM. The SEM focuses an electron beam at a point on the surface of the sample and then measures the resulting electrons with a detector. By doing this in a raster pattern across the surface an image is formed, pixel by pixel. At the top of the image is the column where the electron beam is generated and focused. From the column comes the electron beam, also called the primary electrons, shown here in blue. When the primary electrons impact the surface they generate secondary electrons, backscattered electrons, Auger electrons, X-ray photons and cathodeluminescence.

Edit and compile if you like:
% Scanning electron microscopy
% Author: Eric Jensen
\documentclass[a4paper,10pt]{article}
\usepackage{tikz}
\usepackage[active,tightpage]{preview}
\PreviewEnvironment{tikzpicture}
\setlength\PreviewBorder{10pt}%
\usetikzlibrary{%
	calc,%
	decorations.pathmorphing,%
	fadings,%
	shadings%
}
\renewcommand*{\familydefault}{\sfdefault}

\begin{document}
\begin{tikzpicture}
  \draw[gray,fill=gray,path fading=south] (0,0) rectangle +(5,-2);% sample
    \begin{scope}[decoration={snake,amplitude=.4mm,
        segment length=2mm,post length=1mm}]
      \draw[decorate,blue,->] (2.5,0) -- ++(112:3);% x-ray
      \draw[decorate,red,->] (2.5,0) -- ++(5:2);% auger
      \draw[decorate,orange,->] (2.5,0) -- ++(45:3);% cathodlimuescence
    \end{scope}
  \fill[color=red, path fading=north,fading transform={rotate=-15}]
    (2.5,0) ++(60:3) ++(150:0.1) -- ++(-30:0.2) -- (2.5,0) -- cycle;%backscatter
  \fill[color=green, path fading=north,fading transform={rotate=45}]
    (2.5,0) ++(135:2) ++(225:0.3) -- ++(45:0.6) -- (2.5,0) -- cycle;%secondary
  \shade[inner color=blue, top color=blue] (2.2,1.8)
    -- ++(0.6,0) -- ++(-0.3,-1.8) -- cycle;%primary electrons

  \shade[left color=gray!50!white,right color=gray] (1.7,3)
    -- ++(1.6,0) -- ++(-0.3,-1) -- ++(-1,0) -- cycle;% column
  \shade[left color=gray!50!white,right color=gray] (2.1,2)
    -- ++(0.8,0) -- ++(0,-0.2) -- ++(-0.8,0) -- cycle;% column bottom
  \draw[gray!80!black] (1.7,3) -- ++(1.6,0) -- ++(-0.3,-1)
    -- ++(-1,0) -- cycle;%column
  \draw[gray!80!black] (2.1,2) -- ++(0,-0.2) -- ++(0.8,0)
    -- ++(0,0.2);%column bottom

  \shade[left color=gray!50!white,right color=gray] (2.5,0) ++(135:2) --
    ++(225:0.3) -- ++(135:0.8) -- ++(45:0.6) -- ++(315:0.8) -- cycle;% detector

  %labels
  \draw (0,-2) node[above right] {\footnotesize Sample};
  \draw (2.5,0) ++(5:2) node[right] {\footnotesize Auger};
  \draw (2.5,0) ++(45:3) node[right] {\footnotesize Cathodeluminescence};
  \draw (2.5,0) ++(60:3) node[right] {\footnotesize Backscattered};
  \draw (2.5,0) ++(112:3) node[left] {\footnotesize X-ray};
  \draw (2.5,0) ++(135:1.2) node[left=0.4cm] {\footnotesize Secondary};
  \draw (2.5,0) ++(135:2) ++(225:0.3) ++(135:0.8) node[left]
    {\footnotesize Detector};
\end{tikzpicture}
\end{document}
Click to download: scanning-electron-microscopy.tex • scanning-electron-microscopy.pdf
Open in Overleaf: scanning-electron-microscopy.tex

