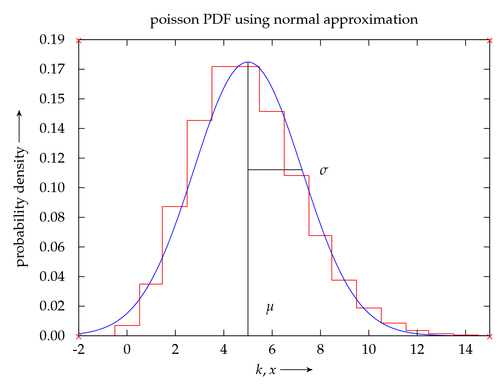
A demonstration of output from Peter Hedwig's Gnuplot TikZ terminal . The terminal translates plots to a series of TikZ commands. This ensures font and line width consistency, and it is straightforward to customize the plot afterwards. For more details and examples, see Peter Hedwig's gnuplot page.
Gnuplot code for generating the plot:
set terminal lua fulldoc \
solid originreset plotsize 9,6.5
set output 'ntest.tex'
set format x "%2.0f"
set format y "%3.2f"
unset key
set label 1 '$\mu$' at 5.5, 0.0193014, 0 left norotate back nopoint offset character 0, 0, 0
set label 2 '$\sigma$' at 7.73607, 0.108213, 0 left norotate back nopoint offset character 0, 0, 0
set arrow 1 from 5, 0, 0 to 5, 0.178412, 0 nohead back nofilled linetype -1 linewidth 1.000
set arrow 2 from 5, 0.108213, 0 to 7.23607, 0.108213, 0 nohead back nofilled linetype -1 linewidth 1.000
set samples 200, 200
set ytics border in scale 1,0.5 mirror norotate  offset character 0, 0, 0 0.00000,0.0193014,0.193014
set title "poisson PDF using normal approximation"
set xlabel '$k, x$ \tikz[baseline]{\draw[yshift=.7ex,->](0,0)--(.7,0);}'
set xrange [ -2.00000 : 15.0000 ] noreverse nowriteback
set ylabel 'probability density \tikz[baseline]{\draw[yshift=.7ex,->](0,0)--(.7,0);}'
set yrange [ 0.00000 : 0.193014 ] noreverse nowriteback
isint(x)=(int(x)==x)
normal(x,mu,sigma)=sigma<=0?1/0:invsqrt2pi/sigma*exp(-0.5*((x-mu)/sigma)**2)
poisson(x,mu)=mu<=0?1/0:!isint(x)?1/0:x<0?0.0:exp(x*log(mu)-lgamma(x+1)-mu)
rnd(x) = floor(x+0.5)
fourinvsqrtpi = 2.25675833419103
invsqrt2pi = 0.398942280401433
twopi = 6.28318530717959
mu = 5.0
sigma = 2.23606797749979
plot poisson(rnd(x), mu) with histeps,\
normal(x, mu, sigma) # title '$\mathrm{normal}(x, \mu, \sigma)$'

Edit and compile if you like:
% Gnuplot TikZ terminal
% Author: Peter Hedwig
\documentclass{article}

%\usepackage{tikz}
\usepackage{gnuplot-lua-tikz}
\usepackage{mathpazo}

\begin{document}


\begin{tikzpicture}[gnuplot]
%% generated with GNUPLOT 4.2p0 (Lua 5.1.2; terminal rev. 42, script rev. 48)
%% Thu Aug 16 14:56:08 2007
%% DEBUG reset
%% DEBUG backtext
\color{gp_lt_color_b}
\gpsetlinetype{gp_lt_border}
\gpsetlinewidth{1.00}
\draw (0.000,0.000)--(0.125,0.000);
\draw (9.000,0.000)--(8.875,0.000);
\node[anchor=mid east] at (-0.180,0.000) {0.00};
\draw (0.000,0.650)--(0.125,0.650);
\draw (9.000,0.650)--(8.875,0.650);
\node[anchor=mid east] at (-0.180,0.650) {0.02};
\draw (0.000,1.300)--(0.125,1.300);
\draw (9.000,1.300)--(8.875,1.300);
\node[anchor=mid east] at (-0.180,1.300) {0.04};
\draw (0.000,1.950)--(0.125,1.950);
\draw (9.000,1.950)--(8.875,1.950);
\node[anchor=mid east] at (-0.180,1.950) {0.06};
\draw (0.000,2.600)--(0.125,2.600);
\draw (9.000,2.600)--(8.875,2.600);
\node[anchor=mid east] at (-0.180,2.600) {0.08};
\draw (0.000,3.250)--(0.125,3.250);
\draw (9.000,3.250)--(8.875,3.250);
\node[anchor=mid east] at (-0.180,3.250) {0.10};
\draw (0.000,3.900)--(0.125,3.900);
\draw (9.000,3.900)--(8.875,3.900);
\node[anchor=mid east] at (-0.180,3.900) {0.12};
\draw (0.000,4.550)--(0.125,4.550);
\draw (9.000,4.550)--(8.875,4.550);
\node[anchor=mid east] at (-0.180,4.550) {0.14};
\draw (0.000,5.200)--(0.125,5.200);
\draw (9.000,5.200)--(8.875,5.200);
\node[anchor=mid east] at (-0.180,5.200) {0.15};
\draw (0.000,5.850)--(0.125,5.850);
\draw (9.000,5.850)--(8.875,5.850);
\node[anchor=mid east] at (-0.180,5.850) {0.17};
\draw (0.000,6.500)--(0.125,6.500);
\draw (9.000,6.500)--(8.875,6.500);
\node[anchor=mid east] at (-0.180,6.500) {0.19};
\draw (0.000,0.000)--(0.000,0.128);
\draw (0.000,6.500)--(0.000,6.372);
\node[anchor=mid] at (0.000,-0.298) {-2};
\draw (1.059,0.000)--(1.059,0.128);
\draw (1.059,6.500)--(1.059,6.372);
\node[anchor=mid] at (1.059,-0.298) { 0};
\draw (2.117,0.000)--(2.117,0.128);
\draw (2.117,6.500)--(2.117,6.372);
\node[anchor=mid] at (2.117,-0.298) { 2};
\draw (3.177,0.000)--(3.177,0.128);
\draw (3.177,6.500)--(3.177,6.372);
\node[anchor=mid] at (3.177,-0.298) { 4};
\draw (4.236,0.000)--(4.236,0.128);
\draw (4.236,6.500)--(4.236,6.372);
\node[anchor=mid] at (4.236,-0.298) { 6};
\draw (5.294,0.000)--(5.294,0.128);
\draw (5.294,6.500)--(5.294,6.372);
\node[anchor=mid] at (5.294,-0.298) { 8};
\draw (6.353,0.000)--(6.353,0.128);
\draw (6.353,6.500)--(6.353,6.372);
\node[anchor=mid] at (6.353,-0.298) {10};
\draw (7.411,0.000)--(7.411,0.128);
\draw (7.411,6.500)--(7.411,6.372);
\node[anchor=mid] at (7.411,-0.298) {12};
\draw (8.470,0.000)--(8.470,0.128);
\draw (8.470,6.500)--(8.470,6.372);
\node[anchor=mid] at (8.470,-0.298) {14};
\draw (0.000,6.500)--(0.000,0.000)--(9.000,0.000)--(9.000,6.500)--cycle;
\node[anchor=mid,rotate=90] at (-1.282,3.250) {probability density \tikz[baseline]{\draw[yshift=.7ex,->](0,0)--(.7,0);}};
\node[anchor=mid] at (4.500,-0.746) {$k, x$ \tikz[baseline]{\draw[yshift=.7ex,->](0,0)--(.7,0);}};
\node[anchor=mid] at (4.500,6.948) {poisson PDF using normal approximation};
\node[anchor=mid west] at (3.970,0.650) {$\mu$};
\node[anchor=mid west] at (5.155,3.644) {$\sigma$};
\draw[](3.706,0.000)--(3.706,6.008);
\draw[](3.706,3.644)--(4.889,3.644);
%% DEBUG fronttext
\color{gp_lt_color0}
\draw (-0.022,0.000)--(-0.022,0.000);
\draw (0.000,0.000)--(0.022,0.000)--(0.067,0.000)--(0.114,0.000)%
  --(0.159,0.000)--(0.204,0.000)--(0.249,0.000)--(0.294,0.000)--(0.340,0.000)%
  --(0.385,0.000)--(0.430,0.000)--(0.475,0.000)--(0.520,0.000)--(0.566,0.000)%
  --(0.611,0.000)--(0.656,0.000)--(0.701,0.000)--(0.746,0.000)--(0.792,0.000)%
  --(0.792,0.227)--(0.837,0.227)--(0.882,0.227)--(0.927,0.227)--(0.972,0.227)%
  --(1.018,0.227)--(1.063,0.227)--(1.108,0.227)--(1.153,0.227)--(1.198,0.227)%
  --(1.244,0.227)--(1.289,0.227)--(1.334,0.227)--(1.334,1.134)--(1.379,1.134)%
  --(1.424,1.134)--(1.470,1.134)--(1.515,1.134)--(1.560,1.134)--(1.605,1.134)%
  --(1.650,1.134)--(1.696,1.134)--(1.741,1.134)--(1.786,1.134)--(1.831,1.134)%
  --(1.831,2.836)--(1.876,2.836)--(1.923,2.836)--(1.968,2.836)--(2.013,2.836)%
  --(2.058,2.836)--(2.103,2.836)--(2.149,2.836)--(2.194,2.836)--(2.239,2.836)%
  --(2.284,2.836)--(2.329,2.836)--(2.375,2.836)--(2.375,4.727)--(2.420,4.727)%
  --(2.465,4.727)--(2.510,4.727)--(2.555,4.727)--(2.601,4.727)--(2.646,4.727)%
  --(2.691,4.727)--(2.736,4.727)--(2.781,4.727)--(2.827,4.727)--(2.872,4.727)%
  --(2.917,4.727)--(2.917,5.909)--(2.962,5.909)--(3.007,5.909)--(3.053,5.909)%
  --(3.098,5.909)--(3.143,5.909)--(3.188,5.909)--(3.233,5.909)--(3.279,5.909)%
  --(3.324,5.909)--(3.369,5.909)--(3.414,5.909)--(3.459,5.909)--(3.505,5.909)%
  --(3.550,5.909)--(3.595,5.909)--(3.640,5.909)--(3.685,5.909)--(3.732,5.909)%
  --(3.777,5.909)--(3.822,5.909)--(3.867,5.909)--(3.912,5.909)--(3.958,5.909)%
  --(3.958,4.924)--(4.003,4.924)--(4.048,4.924)--(4.093,4.924)--(4.138,4.924)%
  --(4.184,4.924)--(4.229,4.924)--(4.274,4.924)--(4.319,4.924)--(4.364,4.924)%
  --(4.410,4.924)--(4.455,4.924)--(4.500,4.924)--(4.500,3.517)--(4.545,3.517)%
  --(4.590,3.517)--(4.636,3.517)--(4.681,3.517)--(4.726,3.517)--(4.771,3.517)%
  --(4.816,3.517)--(4.862,3.517)--(4.907,3.517)--(4.952,3.517)--(4.997,3.517)%
  --(5.042,3.517)--(5.042,2.199)--(5.088,2.199)--(5.133,2.199)--(5.178,2.199)%
  --(5.223,2.199)--(5.268,2.199)--(5.314,2.199)--(5.359,2.199)--(5.404,2.199)%
  --(5.449,2.199)--(5.494,2.199)--(5.541,2.199)--(5.541,1.221)--(5.586,1.221)%
  --(5.631,1.221)--(5.676,1.221)--(5.721,1.221)--(5.767,1.221)--(5.812,1.221)%
  --(5.857,1.221)--(5.902,1.221)--(5.947,1.221)--(5.993,1.221)--(6.038,1.221)%
  --(6.083,1.221)--(6.083,0.611)--(6.128,0.611)--(6.173,0.611)--(6.219,0.611)%
  --(6.264,0.611)--(6.309,0.611)--(6.354,0.611)--(6.399,0.611)--(6.445,0.611)%
  --(6.490,0.611)--(6.535,0.611)--(6.580,0.611)--(6.625,0.611)--(6.625,0.278)%
  --(6.671,0.278)--(6.716,0.278)--(6.761,0.278)--(6.806,0.278)--(6.851,0.278)%
  --(6.897,0.278)--(6.942,0.278)--(6.987,0.278)--(7.032,0.278)--(7.077,0.278)%
  --(7.123,0.278)--(7.168,0.278)--(7.168,0.115)--(7.213,0.115)--(7.258,0.115)%
  --(7.303,0.115)--(7.350,0.115)--(7.395,0.115)--(7.440,0.115)--(7.485,0.115)%
  --(7.530,0.115)--(7.576,0.115)--(7.621,0.115)--(7.666,0.115)--(7.666,0.045)%
  --(7.711,0.045)--(7.756,0.045)--(7.802,0.045)--(7.847,0.045)--(7.892,0.045)%
  --(7.937,0.045)--(7.982,0.045)--(8.028,0.045)--(8.073,0.045)--(8.118,0.045)%
  --(8.163,0.045)--(8.208,0.045)--(8.208,0.016)--(8.254,0.016)--(8.299,0.016)%
  --(8.344,0.016)--(8.389,0.016)--(8.434,0.016)--(8.480,0.016)--(8.525,0.016)%
  --(8.570,0.016)--(8.615,0.016)--(8.660,0.016)--(8.706,0.016)--(8.751,0.016)%
  --(8.751,0.005)--(8.796,0.005)--(8.841,0.005)--(8.886,0.005)--(8.932,0.005)%
  --(8.977,0.005)--(9.000,0.005);
\color{gp_lt_color1}
\draw (0.000,0.045)--(0.045,0.051)--(0.090,0.056)--(0.136,0.064)%
  --(0.181,0.071)--(0.226,0.080)--(0.271,0.090)--(0.316,0.099)--(0.362,0.111)%
  --(0.407,0.124)--(0.452,0.138)--(0.497,0.153)--(0.542,0.169)--(0.588,0.187)%
  --(0.633,0.207)--(0.678,0.228)--(0.723,0.251)--(0.768,0.277)--(0.814,0.304)%
  --(0.859,0.333)--(0.904,0.366)--(0.949,0.400)--(0.994,0.437)--(1.041,0.476)%
  --(1.086,0.518)--(1.131,0.564)--(1.176,0.612)--(1.221,0.664)--(1.267,0.719)%
  --(1.312,0.777)--(1.357,0.839)--(1.402,0.905)--(1.447,0.973)--(1.493,1.046)%
  --(1.538,1.123)--(1.583,1.203)--(1.628,1.288)--(1.673,1.376)--(1.719,1.468)%
  --(1.764,1.564)--(1.809,1.664)--(1.854,1.768)--(1.899,1.875)--(1.945,1.986)%
  --(1.990,2.102)--(2.035,2.219)--(2.080,2.340)--(2.125,2.465)--(2.171,2.592)%
  --(2.216,2.722)--(2.261,2.854)--(2.306,2.988)--(2.351,3.123)--(2.397,3.261)%
  --(2.442,3.398)--(2.487,3.538)--(2.532,3.677)--(2.577,3.816)--(2.623,3.955)%
  --(2.668,4.092)--(2.713,4.228)--(2.758,4.363)--(2.803,4.495)--(2.850,4.625)%
  --(2.895,4.751)--(2.940,4.873)--(2.985,4.991)--(3.030,5.105)--(3.076,5.214)%
  --(3.121,5.317)--(3.166,5.415)--(3.211,5.506)--(3.256,5.590)--(3.302,5.668)%
  --(3.347,5.738)--(3.392,5.801)--(3.437,5.856)--(3.482,5.902)--(3.528,5.940)%
  --(3.573,5.970)--(3.618,5.992)--(3.663,6.004)--(3.708,6.008)--(3.754,6.003)%
  --(3.799,5.990)--(3.844,5.968)--(3.889,5.936)--(3.934,5.897)--(3.980,5.849)%
  --(4.025,5.794)--(4.070,5.730)--(4.115,5.659)--(4.160,5.581)--(4.206,5.495)%
  --(4.251,5.403)--(4.296,5.305)--(4.341,5.201)--(4.386,5.092)--(4.433,4.978)%
  --(4.478,4.858)--(4.522,4.736)--(4.567,4.609)--(4.614,4.480)--(4.659,4.347)%
  --(4.704,4.213)--(4.749,4.076)--(4.794,3.938)--(4.840,3.800)--(4.885,3.660)%
  --(4.930,3.521)--(4.975,3.383)--(5.020,3.244)--(5.066,3.107)--(5.111,2.971)%
  --(5.156,2.838)--(5.201,2.706)--(5.246,2.577)--(5.292,2.450)--(5.337,2.326)%
  --(5.382,2.205)--(5.427,2.088)--(5.472,1.973)--(5.518,1.863)--(5.563,1.756)%
  --(5.608,1.652)--(5.653,1.553)--(5.698,1.458)--(5.744,1.365)--(5.789,1.278)%
  --(5.834,1.194)--(5.879,1.113)--(5.924,1.037)--(5.970,0.965)--(6.015,0.896)%
  --(6.060,0.832)--(6.105,0.770)--(6.150,0.712)--(6.196,0.657)--(6.241,0.606)%
  --(6.286,0.558)--(6.331,0.513)--(6.376,0.471)--(6.423,0.432)--(6.468,0.395)%
  --(6.513,0.361)--(6.558,0.330)--(6.603,0.301)--(6.649,0.274)--(6.694,0.249)%
  --(6.739,0.226)--(6.784,0.205)--(6.829,0.185)--(6.875,0.167)--(6.920,0.151)%
  --(6.965,0.136)--(7.010,0.122)--(7.055,0.109)--(7.101,0.099)--(7.146,0.088)%
  --(7.191,0.079)--(7.236,0.070)--(7.281,0.063)--(7.327,0.056)--(7.372,0.050)%
  --(7.417,0.044)--(7.462,0.039)--(7.507,0.035)--(7.553,0.031)--(7.598,0.027)%
  --(7.643,0.024)--(7.688,0.021)--(7.733,0.018)--(7.779,0.016)--(7.824,0.014)%
  --(7.869,0.012)--(7.914,0.011)--(7.959,0.009)--(8.005,0.008)--(8.050,0.007)%
  --(8.095,0.006)--(8.140,0.005)--(8.185,0.005)--(8.232,0.004)--(8.277,0.003)%
  --(8.322,0.003)--(8.367,0.002)--(8.412,0.002)--(8.458,0.002)--(8.503,0.002)%
  --(8.548,0.002)--(8.593,0.001)--(8.638,0.001)--(8.684,0.001)--(8.729,0.001)%
  --(8.774,0.001)--(8.819,0.001)--(8.864,0.001)--(8.910,0.000)--(8.955,0.000)--(9.000,0.000);
\color{gp_lt_color_b}
\draw (0.000,6.500)--(0.000,0.000)--(9.000,0.000)--(9.000,6.500)--cycle;
%% DEBUG end_text
%% coordinates of the plot area
\coordinate (gpbb lowerleft 1) at (0.000,0.000);
\coordinate (gpbb lowerright 1) at (9.000,0.000);
\coordinate (gpbb upperright 1) at (9.000,6.500);
\coordinate (gpbb upperleft 1) at (0.000,6.500);

%%
%% show plot corners
%%
\draw[color=red] plot[mark=x] coordinates {(gpbb upperright 1)};
\draw[color=red] plot[mark=x] coordinates {(gpbb lowerright 1)};
\draw[color=red] plot[mark=x] coordinates {(gpbb upperleft 1)};
\draw[color=red] plot[mark=x] coordinates {(gpbb lowerleft 1)};
\end{tikzpicture}


\end{document}
Click to download: gnuplot-tikz-terminal.tex • gnuplot-tikz-terminal.pdf
Open in Overleaf: gnuplot-tikz-terminal.tex


