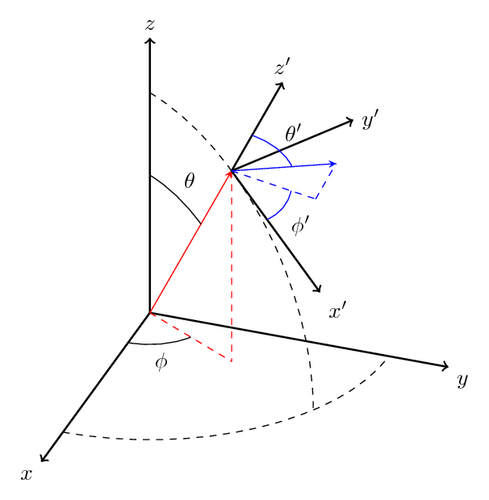
The tikz-3dplot package provides straightforward ways to define three-dimensional coordinate frames through which to plot in TikZ. The user can specify the orientation of the main coordinate frame, and use standard TikZ commands and coordinates to render their tikzfigure. A secondary coordinate frame is provided to allow rotations and translations with respect to the main coordinate frame.

Edit and compile if you like:
%% Copyright 2009 Jeffrey D. Hein
%
% This work may be distributed and/or modified under the
% conditions of the LaTeX Project Public License, either version 1.3
% of this license or (at your option) any later version.
% The latest version of this license is in
%   http://www.latex-project.org/lppl.txt
% and version 1.3 or later is part of all distributions of LaTeX
% version 2005/12/01 or later.
%
% This work has the LPPL maintenance status `maintained'.
%
% The Current Maintainer of this work is Jeffrey D. Hein.
%
% This work consists of the files 3dplot.sty and 3dplot.tex

%Description
%-----------
%3dplot.tex - an example file demonstrating the use of the 3dplot.sty package.

%Created 2009-11-07 by Jeff Hein.  Last updated: 2009-11-09
%----------------------------------------------------------

%Update Notes
%------------

%2009-11-07: Created file along with 3dplot.sty package


\documentclass{article}


\usepackage{tikz}   %TikZ is required for this to work.  Make sure this exists before the next line
\usepackage{tikz-3dplot} %requires 3dplot.sty to be in same directory, or in your LaTeX installation
\usepackage[active,tightpage]{preview}  %generates a tightly fitting border around the work
\PreviewEnvironment{tikzpicture}
\setlength\PreviewBorder{2mm}

\begin{document}

%Angle Definitions
%-----------------

%set the plot display orientation
%synatax: \tdplotsetdisplay{\theta_d}{\phi_d}
\tdplotsetmaincoords{60}{110}

%define polar coordinates for some vector
%TODO: look into using 3d spherical coordinate system
\pgfmathsetmacro{\rvec}{.8}
\pgfmathsetmacro{\thetavec}{30}
\pgfmathsetmacro{\phivec}{60}

%start tikz picture, and use the tdplot_main_coords style to implement the display
%coordinate transformation provided by 3dplot
\begin{tikzpicture}[scale=5,tdplot_main_coords]

%set up some coordinates
%-----------------------
\coordinate (O) at (0,0,0);

%determine a coordinate (P) using (r,\theta,\phi) coordinates.  This command
%also determines (Pxy), (Pxz), and (Pyz): the xy-, xz-, and yz-projections
%of the point (P).
%syntax: \tdplotsetcoord{Coordinate name without parentheses}{r}{\theta}{\phi}
\tdplotsetcoord{P}{\rvec}{\thetavec}{\phivec}

%draw figure contents
%--------------------

%draw the main coordinate system axes
\draw[thick,->] (0,0,0) -- (1,0,0) node[anchor=north east]{$x$};
\draw[thick,->] (0,0,0) -- (0,1,0) node[anchor=north west]{$y$};
\draw[thick,->] (0,0,0) -- (0,0,1) node[anchor=south]{$z$};

%draw a vector from origin to point (P)
\draw[-stealth,color=red] (O) -- (P);

%draw projection on xy plane, and a connecting line
\draw[dashed, color=red] (O) -- (Pxy);
\draw[dashed, color=red] (P) -- (Pxy);

%draw the angle \phi, and label it
%syntax: \tdplotdrawarc[coordinate frame, draw options]{center point}{r}{angle}{label options}{label}
\tdplotdrawarc{(O)}{0.2}{0}{\phivec}{anchor=north}{$\phi$}


%set the rotated coordinate system so the x'-y' plane lies within the
%"theta plane" of the main coordinate system
%syntax: \tdplotsetthetaplanecoords{\phi}
\tdplotsetthetaplanecoords{\phivec}

%draw theta arc and label, using rotated coordinate system
\tdplotdrawarc[tdplot_rotated_coords]{(0,0,0)}{0.5}{0}{\thetavec}{anchor=south west}{$\theta$}

%draw some dashed arcs, demonstrating direct arc drawing
\draw[dashed,tdplot_rotated_coords] (\rvec,0,0) arc (0:90:\rvec);
\draw[dashed] (\rvec,0,0) arc (0:90:\rvec);

%set the rotated coordinate definition within display using a translation
%coordinate and Euler angles in the "z(\alpha)y(\beta)z(\gamma)" euler rotation convention
%syntax: \tdplotsetrotatedcoords{\alpha}{\beta}{\gamma}
\tdplotsetrotatedcoords{\phivec}{\thetavec}{0}

%translate the rotated coordinate system
%syntax: \tdplotsetrotatedcoordsorigin{point}
\tdplotsetrotatedcoordsorigin{(P)}

%use the tdplot_rotated_coords style to work in the rotated, translated coordinate frame
\draw[thick,tdplot_rotated_coords,->] (0,0,0) -- (.5,0,0) node[anchor=north west]{$x'$};
\draw[thick,tdplot_rotated_coords,->] (0,0,0) -- (0,.5,0) node[anchor=west]{$y'$};
\draw[thick,tdplot_rotated_coords,->] (0,0,0) -- (0,0,.5) node[anchor=south]{$z'$};

%WARNING:  coordinates defined by the \coordinate command (eg. (O), (P), etc.)
%cannot be used in rotated coordinate frames.  Use only literal coordinates.

%draw some vector, and its projection, in the rotated coordinate frame
\draw[-stealth,color=blue,tdplot_rotated_coords] (0,0,0) -- (.2,.2,.2);
\draw[dashed,color=blue,tdplot_rotated_coords] (0,0,0) -- (.2,.2,0);
\draw[dashed,color=blue,tdplot_rotated_coords] (.2,.2,0) -- (.2,.2,.2);

%show its phi arc and label
\tdplotdrawarc[tdplot_rotated_coords,color=blue]{(0,0,0)}{0.2}{0}{45}{anchor=north west,color=black}{$\phi'$}

%change the rotated coordinate frame so that it lies in its theta plane.
%Note that this overwrites the original rotated coordinate frame
%syntax: \tdplotsetrotatedthetaplanecoords{\phi'}
\tdplotsetrotatedthetaplanecoords{45}

%draw theta arc and label
\tdplotdrawarc[tdplot_rotated_coords,color=blue]{(0,0,0)}{0.2}{0}{55}{anchor=south west,color=black}{$\theta'$}

\end{tikzpicture}

\end{document}
Click to download: the-3dplot-package.tex • the-3dplot-package.pdf
Open in Overleaf: the-3dplot-package.tex

