


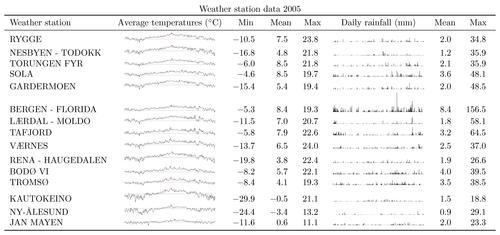
This table shows one year of daily average temperatures and rainfall data from a handful of weather stations in Norway. The report was generated from a data set downloaded from www.met.no. A Python script was used to do the necessary data crunching and text formatting. For details about the plotting, see my first sparklines experiment entry.
To compile this example you'll need this include file:
Edit and compile if you like:
\documentclass{article}

\usepackage[utf8]{inputenc}
\usepackage{tikz}
\usepackage{dcolumn}
\usepackage{booktabs}
\usepackage{lscape}


\begin{document}
\pagestyle{empty}

\input{weatherdata.txt}

% Plot a tiny temperature graph
% Input:
%   #1 Plot data
%   #2 Mark indices
%   #3 Mean temperature
\newcommand{\tempplot}[3]{%
    \begin{tikzpicture}[xscale=0.01, yscale=0.01]
        \draw[ultra thin, black!50] (1,0)--(365,0);
        \draw[ultra thin, black!20] (1,#3)--(365,#3);
        \draw[ultra thin] plot[smooth,mark=*, mark indices={#2},
            mark options={color=red,scale=20}] #1;
    \end{tikzpicture}%
}

% Plot a tiny rainfall bar chart
% Input:
%   #1 Rainfall data
%   #2 Mean rainfall
\newcommand{\rainplot}[2]{%
    \begin{tikzpicture}[xscale=0.01, yscale=0.01]
        \begin{scope}[ycomb, yscale=0.5]
            \draw[ultra thin, black!20] (1,#2)--(365,#2);
            \draw[black!80, line width=0.1mm] plot #1;
        \end{scope}
    \end{tikzpicture}%
}


\newcolumntype{.}{D{.}{.}{2}}

\begin{tabular}{lc...c..}
    \multicolumn{8}{c}{Weather station data 2005}\\\toprule
    Weather station &
    Average temperatures (${}^\circ$C) &
    \multicolumn{1}{c}{Min} &
    \multicolumn{1}{c}{Mean} &
    \multicolumn{1}{c}{Max} &
    Daily rainfall (mm)&
    \multicolumn{1}{c}{Mean} &
    \multicolumn{1}{c}{Max}\\\midrule
    RYGGE & \tempplot{coordinates {\ryggeTEMPDATA}}
    {61,190}{7.5} & -10.5 & 7.5 & 23.8 &
    \rainplot{coordinates {\ryggeRAINDATA}}{2.0} & 2.0 & 34.8 \\
    NESBYEN - TODOKK & \tempplot{coordinates {\nesbyentodokkTEMPDATA}}
        {353,184}{4.8} & -16.8 & 4.8 & 21.8 &
    \rainplot{coordinates {\nesbyentodokkRAINDATA}}{1.2} & 1.2 & 35.9 \\
    TORUNGEN FYR & \tempplot{coordinates {\torungenfyrTEMPDATA}}
        {61,191}{8.5} & -6.0 & 8.5 & 21.8 &
    \rainplot{coordinates {\torungenfyrRAINDATA}}{2.1} & 2.1 & 35.9 \\
    SOLA & \tempplot{coordinates {\solaTEMPDATA}}
        {61,231}{8.5} & -4.6 & 8.5 & 19.7 &
    \rainplot{coordinates {\solaRAINDATA}}{3.6} & 3.6 & 48.1 \\
    GARDERMOEN & \tempplot{coordinates {\gardermoenTEMPDATA}}
        {61,204}{5.4} & -15.4 & 5.4 & 19.4 &
    \rainplot{coordinates {\gardermoenRAINDATA}}{2.0} & 2.0 & 48.5 \\
    BERGEN - FLORIDA & \tempplot{coordinates {\bergenfloridaTEMPDATA}}
        {363,190}{8.4} & -5.3 & 8.4 & 19.3 &
    \rainplot{coordinates {\bergenfloridaRAINDATA}}{8.4} & 8.4 & 156.5 \\
    LÆRDAL - MOLDO & \tempplot{coordinates {\lrdalmoldoTEMPDATA}}
        {61,284}{7.0} & -11.5 & 7.0 & 20.7 &
    \rainplot{coordinates {\lrdalmoldoRAINDATA}}{1.8} & 1.8 & 58.1 \\
    TAFJORD & \tempplot{coordinates {\tafjordTEMPDATA}}
        {61,186}{7.9} & -5.8 & 7.9 & 22.6 &
    \rainplot{coordinates {\tafjordRAINDATA}}{3.2} & 3.2 & 64.5 \\
    VÆRNES & \tempplot{coordinates {\vrnesTEMPDATA}}
        {58,183}{6.5} & -13.7 & 6.5 & 24.0 &
    \rainplot{coordinates {\vrnesRAINDATA}}{2.5} & 2.5 & 37.0 \\
    RENA - HAUGEDALEN & \tempplot{coordinates {\renahaugedalenTEMPDATA}}
        {351,190}{3.8} & -19.8 & 3.8 & 22.4 &
    \rainplot{coordinates {\renahaugedalenRAINDATA}}{1.9} & 1.9 & 26.6 \\
    BODØ VI & \tempplot{coordinates {\bodviTEMPDATA}}
        {60,185}{5.7} & -8.2 & 5.7 & 22.1 &
    \rainplot{coordinates {\bodviRAINDATA}}{4.0} & 4.0 & 39.5 \\
    TROMSØ & \tempplot{coordinates {\tromsTEMPDATA}}
        {75,188}{4.1} & -8.4 & 4.1 & 19.3 &
    \rainplot{coordinates {\tromsRAINDATA}}{3.5} & 3.5 & 38.5 \\
    KAUTOKEINO & \tempplot{coordinates {\kautokeinoTEMPDATA}}
        {45,189}{-0.5} & -29.9 & -0.5 & 21.1 &
    \rainplot{coordinates {\kautokeinoRAINDATA}}{1.5} & 1.5 & 18.8 \\
    NY-ÅLESUND & \tempplot{coordinates {\nylesundTEMPDATA}}
        {71,188}{-3.4} & -24.4 & -3.4 & 13.2 &
    \rainplot{coordinates {\nylesundRAINDATA}}{0.9} & 0.9 & 29.1 \\
    JAN MAYEN & \tempplot{coordinates {\janmayenTEMPDATA}}
        {97,203}{0.6} & -11.6 & 0.6 & 11.1 &
    \rainplot{coordinates {\janmayenRAINDATA}}{2.0} & 2.0 & 23.3 \\\bottomrule
\end{tabular}

%\end{landscape}
\end{document}
Click to download: weather-stations-data.tex • weather-stations-data.pdf
Open in Overleaf: weather-stations-data.tex