


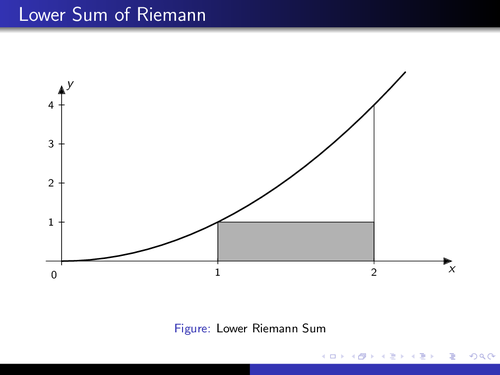
An animation to the area of calculation using the lower Riemann sum.
That's an approximation of an integral by a finite sum, named after the German mathematician Riemann. It is calculated by partitioning the region below the the curve into rectangles and summarizing their areas. To get a better approximation, the region is devided more finely. As the rectangles get smaller, the Rieman sum approaches the Riemann integral.
Edit and compile if you like:
% Animation for Lower Riemann Sum
% Author: Edson José Teixeira
\documentclass[10pt]{beamer}
\usepackage[controls]{animate}
\usepackage{tikz}
\usetikzlibrary{arrows}
% Beamer Settings
\usetheme{Warsaw}
% Counters
\newcounter{lower}
\setcounter{lower}{1}
\begin{document}
\begin{frame}[fragile]{Lower Sum of Riemann}
  \begin{figure}
    \begin{animateinline}[poster = first, controls]{5}
    \whiledo{\thelower<30}{
      \begin{tikzpicture}[line cap=round, line join=round, >=triangle 45,
                          x=4.0cm, y=1.0cm, scale=1]
        \draw[->, color=black] (-0.1,0) -- (2.5,0);
        \foreach \x in {1,2}
          \draw [shift={(\x,0)}, color=black] (0pt,2pt)
                -- (0pt,-2pt) node [below] {\footnotesize $\x$};
        \draw [color=black] (2.5,0) node [below] {$x$};
        \draw [->, color=black] (0,-0.1) -- (0,4.5);
        \foreach \y in {1,2,3,4}
          \draw [shift={(0,\y)}, color=black] (2pt,0pt)
                -- (-2pt,0pt) node[left] {\footnotesize $\y$};
        \draw [color=black] (0,4.5) node [right] {$y$};
        \draw [color=black] (0pt,-10pt) node [left] {\footnotesize $0$};
        \draw [domain=0:2.2, line width=1.0pt] plot (\x,{(\x)^2});
        \clip (0,-0.5) rectangle (3,5);
        \draw (2,0)--(2,4);
        \foreach \i in {1,...,\thelower}
        \draw [fill=black, fill opacity=0.3, smooth,samples=50]
                 ({1+(\i-1)/\thelower}, {(1+(\i-1)/\thelower)^2})
              -- ({1+(\i)/\thelower},   {(1+(\i-1)/\thelower)^2})
              -- ({1+(\i)/\thelower},0)
              -- ({1+(\i-1)/\thelower},0)
              -- cycle;
      \end{tikzpicture}
      \stepcounter{lower}
      \ifthenelse{\thelower<30}{ \newframe }{\end{animateinline} }
    }
    \caption{Lower Riemann Sum}
  \end{figure}
\end{frame}
\end{document}
Click to download: lower-riemann-sum.tex • lower-riemann-sum.pdf
Open in Overleaf: lower-riemann-sum.tex