


Edit and compile if you like:
% Lindenmayer systems
% Dec 18, 2011, Stefan Kottwitz
% http://texblog.net
\documentclass{article}
\usepackage{tikz}
\usepackage[active,tightpage]{preview}
\usepackage{subfig}
\PreviewEnvironment{tabular}
\setlength\PreviewBorder{5pt}%
\usetikzlibrary{lindenmayersystems}
\usetikzlibrary[shadings]
\begin{document}
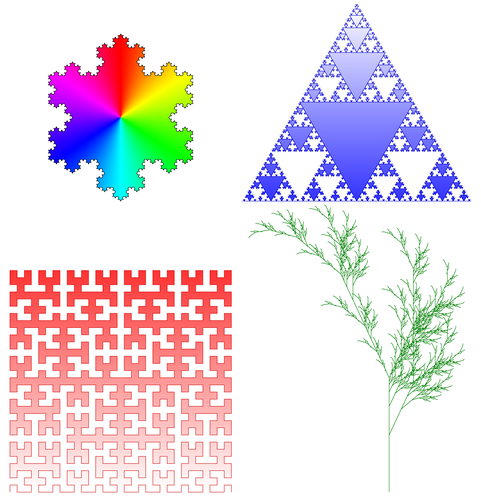
\pgfdeclarelindenmayersystem{Koch curve}{
\rule{F -> F-F++F-F}}
\pgfdeclarelindenmayersystem{Sierpinski triangle}{
\rule{F -> G-F-G}
\rule{G -> F+G+F}}
\pgfdeclarelindenmayersystem{Fractal plant}{
\rule{X -> F-[[X]+X]+F[+FX]-X}
\rule{F -> FF}}
\pgfdeclarelindenmayersystem{Hilbert curve}{
\rule{L -> +RF-LFL-FR+}
\rule{R -> -LF+RFR+FL-}}
\begin{tabular}{cc}
\begin{tikzpicture}
\shadedraw[shading=color wheel]
[l-system={Koch curve, step=2pt, angle=60, axiom=F++F++F, order=4}]
lindenmayer system -- cycle;
\end{tikzpicture}
&
\begin{tikzpicture}
\shadedraw [top color=white, bottom color=blue!80, draw=blue!80!black]
[l-system={Sierpinski triangle, step=2pt, angle=60, axiom=F, order=8}]
lindenmayer system -- cycle;
\end{tikzpicture}
\\
\begin{tikzpicture}
\shadedraw [bottom color=white, top color=red!80, draw=red!80!black]
[l-system={Hilbert curve, axiom=L, order=5, step=8pt, angle=90}]
lindenmayer system;
\end{tikzpicture}
&
\begin{tikzpicture}
\draw [green!50!black, rotate=90]
[l-system={Fractal plant, axiom=X, order=6, step=2pt, angle=25}]
lindenmayer system;
\end{tikzpicture}
\end{tabular}
\end{document}
Click to download: lindenmayer-systems.tex • lindenmayer-systems.pdf
Open in Overleaf: lindenmayer-systems.tex