Example: Control system principles

Published 2006-11-23 | Author: Kjell Magne Fauske

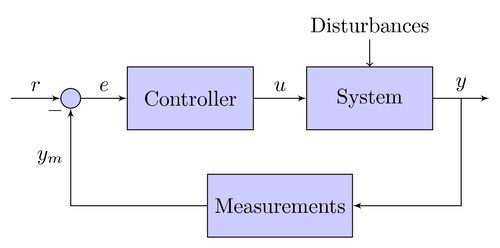
An example of a control system with a feedback loop. Block diagrams like this are quite time consuming to create by hand. The relative node placement feature makes it a bit easier, but it works best when the nodes have equal widths. However, the results are quite pleasing and hopefully worth the effort. You can probably speed up the process by creating custom macros.

Download as: [PDF] [TEX]

Control system principles

Do you have a question regarding this example, TikZ or LaTeX in general? Just ask in the LaTeX Forum.
Oder frag auf Deutsch auf TeXwelt.de. En français: TeXnique.fr.

\documentclass{article}

\usepackage{tikz}
\usetikzlibrary{shapes,arrows}
\begin{document}


\tikzstyle{block} = [draw, fill=blue!20, rectangle, 
    minimum height=3em, minimum width=6em]
\tikzstyle{sum} = [draw, fill=blue!20, circle, node distance=1cm]
\tikzstyle{input} = [coordinate]
\tikzstyle{output} = [coordinate]
\tikzstyle{pinstyle} = [pin edge={to-,thin,black}]

% The block diagram code is probably more verbose than necessary
\begin{tikzpicture}[auto, node distance=2cm,>=latex']
    % We start by placing the blocks
    \node [input, name=input] {};
    \node [sum, right of=input] (sum) {};
    \node [block, right of=sum] (controller) {Controller};
    \node [block, right of=controller, pin={[pinstyle]above:Disturbances},
            node distance=3cm] (system) {System};
    % We draw an edge between the controller and system block to 
    % calculate the coordinate u. We need it to place the measurement block. 
    \draw [->] (controller) -- node[name=u] {$u$} (system);
    \node [output, right of=system] (output) {};
    \node [block, below of=u] (measurements) {Measurements};

    % Once the nodes are placed, connecting them is easy. 
    \draw [draw,->] (input) -- node {$r$} (sum);
    \draw [->] (sum) -- node {$e$} (controller);
    \draw [->] (system) -- node [name=y] {$y$}(output);
    \draw [->] (y) |- (measurements);
    \draw [->] (measurements) -| node[pos=0.99] {$-$} 
        node [near end] {$y_m$} (sum);
\end{tikzpicture}

\end{document}

Comments

  • #1 fit, December 8, 2009 at 2:55 p.m.

    With this figure, I don't want to insert y. How can I do that? Thank you very much and waiting for your help!

  • #2 fit, December 10, 2009 at 6:16 a.m.

    oh, I've got it. Thanks so much.

  • #3 Rupak, January 18, 2010 at 10:57 a.m.

    What if i want to to draw a unity feed back without a measurements block???

  • #4 Erik, February 17, 2010 at 6:33 p.m.

    @3

    That's the same question I have..

    Awesome website btw!

  • #5 Kjell Magne Fauske, February 18, 2010 at 8:06 a.m.

    Here is one possible solution:

    \documentclass{article}
    
    \usepackage{tikz}
    \usetikzlibrary{shapes,arrows}
    \begin{document}
    
    
    \tikzstyle{block} = [draw, fill=blue!20, rectangle, 
        minimum height=3em, minimum width=6em]
    \tikzstyle{sum} = [draw, fill=blue!20, circle, node distance=1cm]
    \tikzstyle{input} = [coordinate]
    \tikzstyle{output} = [coordinate]
    \tikzstyle{pinstyle} = [pin edge={to-,thin,black}]
    
    % The block diagram code is probably more verbose than necessary
    \begin{tikzpicture}[auto, node distance=2cm,>=latex']
        % We start by placing the blocks
        \node [input, name=input] {};
        \node [sum, right of=input] (sum) {};
        \node [block, right of=sum] (controller) {Controller};
        \node [block, right of=controller, pin={[pinstyle]above:Disturbances},
                node distance=3cm] (system) {System};
        % We draw an edge between the controller and system block to 
        % calculate the coordinate u. We need it to place the measurement block. 
        \draw [->] (controller) -- node[name=u] {$u$} (system);
        \node [output, right of=system] (output) {};
        \coordinate [below of=u] (tmp);
    
        % Once the nodes are placed, connecting them is easy. 
        \draw [draw,->] (input) -- node {$r$} (sum);
        \draw [->] (sum) -- node {$e$} (controller);
        \draw [->] (system) -- node [name=y] {$y$}(output);
        \draw [->] (y) |- (tmp) -| node[pos=0.99] {$-$} 
            node [near end] {$y_m$} (sum);
    \end{tikzpicture}
    
    \end{document}
    
  • #6 Tal_nino, May 27, 2012 at 4:54 a.m.

    How to define a first block's position? usually it starts at the left of my beamer frame,that's not what i wated. the [left/right/above of] need a base block,but the firt block does'nt have the reference block.

Adding comments is currently not enabled.