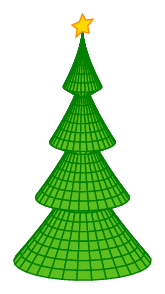
Edit and compile if you like:
% A Christmas tree with pgfplots
% By Jake
\documentclass[border=5mm]{standalone}
\usepackage{pgfplots}
\usepackage[active,tightpage]{preview}
\PreviewEnvironment{tikzpicture}
\setlength\PreviewBorder{5pt}%
\begin{document}
\begin{tikzpicture}
\begin{axis}[
    hide axis, clip=false,
    y domain=0:2*pi,
    samples=30,axis equal, view={45}{20}]
\addplot3 [domain=0:4,surf,shader=flat,z buffer=sort,fill=green!50!brown, draw=green!50!black, line join=bevel]
    ({(1.3*x-floor(x))*x^0.5*cos(deg(y))},
     {(1.3*x-floor(x))*x^0.5*sin(deg(y))},
     {-5*x});
\addplot3 [domain=0:4.5, samples=10, samples y=0, fill=yellow!85!red, draw=yellow!55!red] ({0},{sin(x/5*360) * (1 - x + floor(x)) },{cos(x/5*360) * (1 - x + floor(x) )  + 0.5}) -- cycle;
\end{axis}
\end{tikzpicture}%
\end{document}
Click to download: christmas-tree-4.tex • christmas-tree-4.pdf
Open in Overleaf: christmas-tree-4.tex


