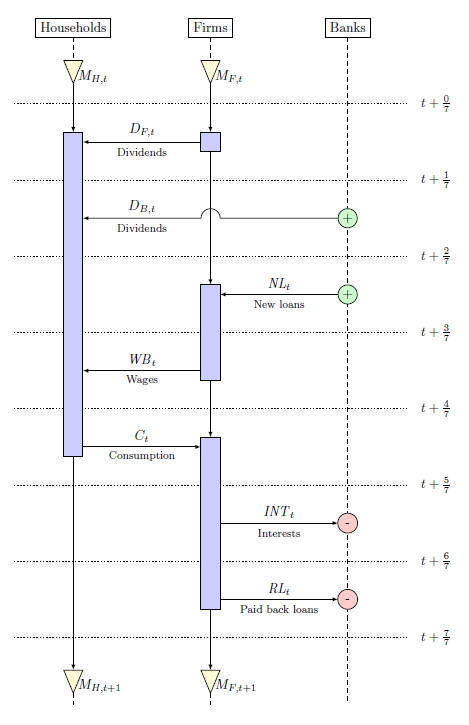
Money flows in an agent-based macroeconomic model with endogenous money

Edit and compile if you like:
% Sequence diagram
% Author: Pascal Seppecher
\documentclass{article}
\usepackage{tikz}
\usepackage[active,tightpage]{preview}
\PreviewEnvironment{tikzpicture}
\setlength\PreviewBorder{5pt}%
\usetikzlibrary{shapes.geometric}
\begin{document}
\pagestyle{empty}

% Agents
\def\Households{Households}
\def\Firms{Firms}
\def\Banks{Banks}

% Money Flows
\def\DF{D_{F,t}} \def \DB {D_{B,t}} \def\Dividends{Dividends}
\def\NL{\mathit{NL}_{t}} \def\NewLoans{New loans}
\def\WB{\mathit{WB}_{t}} \def\Wages{Wages}
\def\SA{C_{t}} \def\Consumption{Consumption}
\def\INT{\mathit{INT}_t} \def\Interests{Interests}
\def\RL{\mathit {RL}_{t}} \def\PaidBackLoans{Paid back loans}

% Diagram
\begin{tikzpicture}[every node/.style={font=\normalsize,
  minimum height=0.5cm,minimum width=0.5cm},]

% Matrix
\node [matrix, very thin,column sep=1.3cm,row sep=0.5cm] (matrix) at (0,0) {
  & \node(0,0) (\Households) {}; & & \node(0,0) (\Firms) {}; &
    & \node(0,0) (\Banks) {}; & \\
  & \node(0,0) (\Households 0) {}; & & \node(0,0) (\Firms 0) {}; & & & \\
  \node(0,0) (t0 left) {}; & & & & & & \node(0,0) (t0 right) {};\\
  & \node(0,0) (\Households 1) {}; & \node(0,0) (\Dividends 1) {};
    & \node(0,0) (\Firms 1) {}; & & & \\
  \node(0,0) (t1 left) {}; & & & & & & \node(0,0) (t1 right) {};\\
  & \node(0,0) (\Households 2) {}; & \node(0,0) (\Dividends 2) {};
    & \node(0,0) (\Firms 2) {}; & & \node(0,0) (\Banks 2) {}; & \\
  \node(0,0) (t2 left) {}; & & & & & & \node(0,0) (t2 right) {};\\
  & & & \node(0,0) (\Firms 3) {}; & \node(0,0) (\NewLoans) {};
    & \node(0,0) (\Banks 3) {}; & \\
  \node(0,0) (t3 left) {}; & & & & & & \node(0,0) (t3 right) {};\\
  & \node(0,0) (\Households 4) {}; & \node(0,0) (\Wages) {};
    & \node(0,0) (\Firms 4) {}; & & & \\
  \node(0,0) (t4 left) {}; & & & & & & \node(0,0) (t4 right) {};\\
  & \node(0,0) (\Households 5) {}; & \node(0,0) (\Consumption) {};
    & \node(0,0) (\Firms 5) {}; & & & \\
  \node(0,0) (t5 left) {}; & & & & & & \node(0,0) (t5 right) {};\\
  & & & \node(0,0) (\Firms 6) {}; & \node(0,0) (\Interests) {};
    & \node(0,0) (\Banks 6) {}; & \\
  \node(0,0) (t6 left) {}; & & & & & & \node(0,0) (t6 right) {};\\
  & & & \node(0,0) (\Firms 7) {}; & \node(0,0) (\PaidBackLoans) {};
    & \node(0,0) (\Banks 7) {}; & \\
  \node(0,0) (t7 left) {}; & & & & & & \node(0,0) (t7 right) {};\\
  & \node(0,0) (\Households 8) {}; & & \node(0,0) (\Firms 8) {}; & & & \\
  & \node(0,0) (\Households 9) {}; & & \node(0,0) (\Firms 9) {}; &
    & \node(0,0) (\Banks 9) {}; & \\
};

% Agents labels
\fill
	(\Households) node[draw,fill=white] {\Households}
	(\Firms) node[draw,fill=white] {\Firms}
	(\Banks) node[draw,fill=white] {\Banks};

% Horizontal time lines
\draw [dotted]
  (t0 left) -- (t0 right) node[right] {$t+\frac{0}{7}$}
  (t1 left) -- (t1 right) node[right] {$t+\frac{1}{7}$}
  (t2 left) -- (t2 right) node[right] {$t+\frac{2}{7}$}
  (t3 left) -- (t3 right) node[right] {$t+\frac{3}{7}$}
  (t4 left) -- (t4 right) node[right] {$t+\frac{4}{7}$}
  (t5 left) -- (t5 right) node[right] {$t+\frac{5}{7}$}
  (t6 left) -- (t6 right) node[right] {$t+\frac{6}{7}$}
  (t7 left) -- (t7 right) node[right] {$t+\frac{7}{7}$};

% Available balances at the beginning of the period
\draw
  (\Households 0)
    node[draw,isosceles triangle,fill=yellow!20, rotate=-90]
      (\Households Balance In) {}
    node[below right] {$M_{H,t}$}
  (\Firms 0)
    node[draw,isosceles triangle,fill=yellow!20, rotate=-90]
      (\Firms Balance In) {}
    node[below right] {$M_{F,t}$};

% Available balances at the end of the period
\draw
  (\Households 8)
    node[draw,isosceles triangle,fill=yellow!20, rotate=-90]
      (\Households Balance Out) {}
    node[below right] {$M_{H,t+1}$}
  (\Firms 8)
    node[draw,isosceles triangle,fill=yellow!20, rotate=-90]
      (\Firms Balance Out) {}
    node[below right] {$M_{F,t+1}$};

% Vertical lifelines
\draw [dashed]
  (\Households) -- (\Households Balance In.west)
  (\Households Balance Out.east) -- (\Households 9)
  (\Firms) -- (\Firms Balance In.west) (\Firms Balance Out.east) -- (\Firms 9)
  (\Banks) -- (\Banks 9);

% Vertical flows (Intertemporal transfers)
\draw [-latex] (\Households Balance In.east) -- (\Households 1);
\draw [-latex] (\Firms Balance In.east) -- (\Firms 1);
\draw [-latex] (\Firms 1) -- (\Firms 3);
\draw [-latex] (\Firms 4) -- (\Firms 5);
\draw [-latex] (\Households 5) -- (\Households Balance Out.west);
\draw [-latex] (\Firms 7) -- (\Firms Balance Out.west);

% Blocks (Budget constraints)
\filldraw[fill=blue!20]
  (\Firms 1.north west) rectangle (\Firms 1.south east)
  (\Households 1.north west) rectangle (\Households 5.south east)
  (\Firms 3.north west) rectangle (\Firms 4.south east)
  (\Firms 5.north west) rectangle (\Firms 7.south east);

% Horizontal flows (Monetary interactions)
\draw [-latex] (\Firms 1) -- (\Households 1);
\draw [-latex] (\Banks 2) -- (\Firms 2.east) arc(0:180:0.25cm)
  -- (\Households 2);
\draw [-latex] (\Banks 3) -- (\Firms 3);
\draw [-latex] (\Firms 4) -- (\Households 4);
\draw [-latex] (\Households 5) -- (\Firms 5);
\draw [-latex] (\Firms 6) -- (\Banks 6);
\draw [-latex] (\Firms 7) -- (\Banks 7);

% Flows Labels
\fill
  (\Dividends 1)
    node[above] {$\DF$}
    node[font=\footnotesize, below] {\Dividends}
 (\Dividends 2)
    node[above] {$\DB$}
    node[font=\footnotesize, below] {\Dividends}
  (\NewLoans)
    node[above] {$\NL$}
    node[font=\footnotesize, below] {\NewLoans}
  (\Wages)
    node[above] {$\WB$}
    node[font=\footnotesize, below] {\Wages}
  (\Consumption)
    node[above] {$\SA$}
    node[font=\footnotesize, below] {\Consumption}
  (\Interests)
    node[above] {$\INT$}
    node[font=\footnotesize, below] {\Interests}
  (\PaidBackLoans)
    node[above] {$\RL$}
    node[font=\footnotesize, below] {\PaidBackLoans};

% Money creation
\draw
  (\Banks 2) node[draw,circle,fill=green!20] {} node {+}
  (\Banks 3) node[draw,circle,fill=green!20] {} node {+};

% Money destruction
\draw
  (\Banks 6) node[draw,circle,fill=red!20] {-}
  (\Banks 7) node[draw,circle,fill=red!20] {-};

\end{tikzpicture}
\end{document}
Click to download: sequence-diagram.tex • sequence-diagram.pdf
Open in Overleaf: sequence-diagram.tex


