")


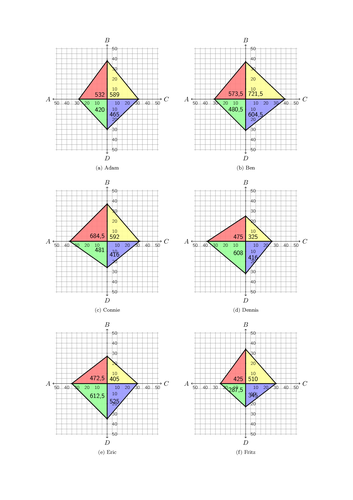
In this example TikZ is used to produce the graphic output of a personality test developed by Prof. Poul Sveistrup.
Edit and compile if you like:
% In this document Tikz is used to produce the graphic output of
% personality test by Sveistrup. More on the test (in Danish) here:
% http://www.socsci.auc.dk/samfbasis/kurser/projektarb/2006_7_farvetest.doc
% Author: Rasmus Pank Roulund
\documentclass[DIV=14]{scrartcl}
\pagestyle{empty}
\usepackage{tikz}
\usepackage{fltpoint}
\usepackage{subfig}
%Adding new counters
\newcounter{lenA}\newcounter{lenB}
\newcounter{lenC}\newcounter{lenD}
\newcommand{\svenstrup}[4]{
\setcounter{lenA}{#1}%
\setcounter{lenB}{#2}%
\setcounter{lenC}{#3}%
\setcounter{lenD}{#4}%
\fpMul{\fourAB}{\thelenA}{\thelenB}%
\fpDiv{\threeAB}{\fourAB}{2}%
%
\fpMul{\fourBC}{\thelenB}{\thelenC}%
\fpDiv{\threeBC}{\fourBC}{2}%
%
\fpMul{\fourAD}{\thelenA}{\thelenD}%
\fpDiv{\threeAD}{\fourAD}{2}%
%
\fpMul{\fourCD}{\thelenC}{\thelenD}%
\fpDiv{\threeCD}{\fourCD}{2}%
%
\sffamily
\begin{tikzpicture}[scale=.60]
%Styles are defined.
\tikzstyle{axes}=[]
\tikzstyle{important line}=[very thick]
%Let us lay the grounds.
%grid
\draw[style=help lines, step=0.5cm] (-5.1,-5.1) grid (5.1,5.1);
%AXES
%%We set the style for the follwing to be axes
\begin{scope}[style=axes]
\draw[->] (0,0) -- (-5.4,0) node[left] {$A$} coordinate(x axis);
\draw[->] (0,0) -- (5.4,0) node[right] {$C$} coordinate(x axis);
\draw[->] (0,0) -- (0,5.4) node[above] {$B$} coordinate(y axis);
\draw[->] (0,0) -- (0,-5.4) node[below] {$D$} coordinate(y axis);
\end{scope}
%We will make the important lines.
%They will be filled, and they make out the basics of the figure
\begin{scope}[style=important line,very nearly opaque, text opacity=100]
%Add
%Green
\draw[fill=green!40!white, ] (-\thelenA mm, 0mm) --
(0 mm,-\thelenD mm)
--node[above left] {\threeAD} (0 mm, 0 mm) -- cycle ;
%CD
%Blue
\draw[fill=blue!40!white] (\thelenC mm, 0mm) -- (0 mm,-\thelenD mm) --
node[right] {\threeCD} (0 mm, 0 mm) -- cycle;
%BC
%Yellow
\draw[fill=yellow!40!white] (\thelenC mm, 0mm) -- (0 mm,\thelenB mm)
-- (0 mm, 0 mm) node[above right] {\threeBC} -- cycle;
%AB
%Red
\draw[fill=red!50!white] (-\thelenA mm, 0mm) -- (0 mm,\thelenB mm)
-- (0 mm, 0 mm) node[above left] {\threeAB} -- cycle;
\end{scope}
\begin{scope}[style=axes, nearly opaque]
%tiks on x-axis
\foreach \x in {-5,-4,...,-.1}
\draw (\x,.1pt) -- (\x,-.1pt) node[below]
{\fpAbs{\xpos}{\x}\scriptsize \xpos 0};
\foreach \x in {5,4,...,.1}
\draw[xshift=\x cm] (0,.1pt) -- (0,-.1pt) node[below]
{\fpAbs{\xpos}{\x}\scriptsize \xpos 0};
%tiks p� y-acis
\foreach \y in {5,4,3,...,.1}
\draw[yshift=\y cm] (-1.5pt,0pt) -- (1.5pt,0pt) node[right]
{\fpAbs{\ypos}{\y} \scriptsize \ypos 0};
\foreach \y in {-5,-4,...,-.1}
\draw[yshift=\y cm] (-1.5pt,0pt) -- (1.5pt,0pt) node[right]
{\fpAbs{\ypos}{\y} \scriptsize \ypos 0};
\end{scope}
\normalfont
\end{tikzpicture}
}
\begin{document}
\begin{figure}
\centering
\subfloat[Adam]{\svenstrup{28}{38}{31}{30}}
\quad
\subfloat[Ben]{\svenstrup{31}{37}{39}{31}}\\
\subfloat[Connie]{\svenstrup{37}{37}{32}{26}}
\quad
\subfloat[Dennis]{\svenstrup{38}{25}{26}{32}}\\
\subfloat[Eric]{\svenstrup{35}{27}{30}{35}}
\quad
\subfloat[Fritz]{\svenstrup{25}{34}{30}{23}}
\end{figure}
\end{document}
%%% Local Variables:
%%% mode: latex
%%% TeX-master: t
%%% End:
Click to download: personality-test.tex • personality-test.pdf
Open in Overleaf: personality-test.tex