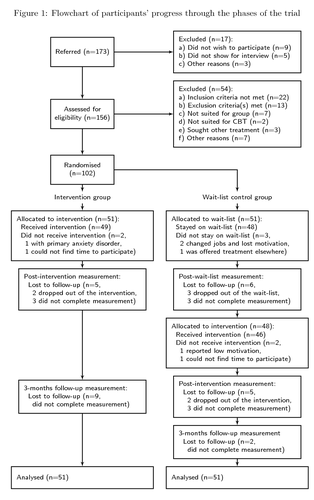
A flowchart is an efficient graphical tool for depicting the progress of subjects through the phases of a clinical trial. This example shows how to use the PGF/TikZ package within a LaTeX article class document to make a flowchart of participants progress through the phases of a randomized controlled trial. The flowchart is meant to conform to the specifications of the CONSORT 2010 Statement guidelines adhered to by the majority of scientific biomedical journals. The author takes no responsibility whether this goal has been achieved successfully, should anyone care to use the example as a template when submitting a manuscript of their own to a biomedical journal.
The basic code regarding placement of the nodes within a matrix, as well as for drawing paths between nodes, was adapted from the example by Kjell Magne Fauske in 'The TikZ and PGF Packages Manual for version 2.00' by Till Tantau.
In the example the tikzpicture-environment is used within a center environment and captionof from the caption package, because floating is not required and conflicts with the preview package. In a common document, a standard figure environment is recommended, which allows the addition of a caption to accompany the flowchart, as well as options for placement of the float when typesetting the document.

Edit and compile if you like:
% A CONSORT-style flowchart of a randomized controlled trial
% using the PGF/TikZ package
% Author  : Morten Vejs Willert (July 2010)
% License : Creative Commons attribution license
\documentclass{article}
\usepackage[latin1]{inputenc}
\usepackage{tikz}
\usepackage[active,tightpage]{preview}
\PreviewEnvironment{center}
\setlength\PreviewBorder{10pt}%
\usetikzlibrary{shapes,arrows}
\usepackage{caption}
\newcommand*{\h}{\hspace{5pt}}% for indentation
\newcommand*{\hh}{\h\h}% double indentation
\begin{document}
\begin{center}
  \captionof{figure}{Flowchart of participants' progress through
    the phases of the trial}
  % setting the typeface to sans serif and the font size to small
  % the scope local to the environment
  \sffamily
  \footnotesize
  \begin{tikzpicture}[auto,
    %decision/.style={diamond, draw=black, thick, fill=white,
    %text width=8em, text badly centered,
    %inner sep=1pt, font=\sffamily\small},
    block_center/.style ={rectangle, draw=black, thick, fill=white,
      text width=8em, text centered,
      minimum height=4em},
    block_left/.style ={rectangle, draw=black, thick, fill=white,
      text width=16em, text ragged, minimum height=4em, inner sep=6pt},
    block_noborder/.style ={rectangle, draw=none, thick, fill=none,
      text width=18em, text centered, minimum height=1em},
    block_assign/.style ={rectangle, draw=black, thick, fill=white,
      text width=18em, text ragged, minimum height=3em, inner sep=6pt},
    block_lost/.style ={rectangle, draw=black, thick, fill=white,
      text width=16em, text ragged, minimum height=3em, inner sep=6pt},
      line/.style ={draw, thick, -latex', shorten >=0pt}]
    % outlining the flowchart using the PGF/TikZ matrix funtion
    \matrix [column sep=5mm,row sep=3mm] {
      % enrollment - row 1
      \node [block_center] (referred) {Referred (n=173)};
      & \node [block_left] (excluded1) {Excluded (n=17): \\
        a) Did not wish to participate (n=9) \\
        b) Did not show for interview (n=5) \\
        c) Other reasons (n=3)}; \\
      % enrollment - row 2
      \node [block_center] (assessment) {Assessed for eligibility (n=156)};
      & \node [block_left] (excluded2) {Excluded (n=54): \\
        a) Inclusion criteria not met (n=22) \\
        b) Exclusion criteria(s) met (n=13) \\
        c) Not suited for group (n=7) \\
        d) Not suited for CBT (n=2) \\
        e) Sought other treatment (n=3) \\
        f) Other reasons (n=7)}; \\
      % enrollment - row 3
      \node [block_center] (random) {Randomised (n=102)};
      & \\
      % follow-up - row 4
      \node [block_noborder] (i) {Intervention group};
      & \node [block_noborder] (wlc) {Wait-list control group}; \\
      % follow-up - row 5
      \node [block_assign] (i_T0) {Allocated to intervention (n=51): \\
      \h Received intervention (n=49) \\
      \h Did not receive intervention (n=2, \\
      \hh 1 with primary anxiety disorder, \\
      \hh 1 could not find time to participate)};
	  & \node [block_assign] (wlc_T0) {Allocated to wait-list (n=51): \\
      \h Stayed on wait-list (n=48) \\
      \h Did not stay on wait-list (n=3, \\
      \hh 2 changed jobs and lost motivation, \\
      \hh 1 was offered treatment elsewhere)}; \\
      % follow-up - row 6
      \node [block_lost] (i_T3) {Post-intervention measurement: \\
      \h Lost to follow-up (n=5, \\
      \hh 2 dropped out of the intervention, \\
      \hh 3 did not complete measurement)};
	  & \node [block_lost] (wlc_T3) {Post-wait-list measurement: \\
      \h Lost to follow-up (n=6, \\
      \hh 3 dropped out of the wait-list, \\
      \hh 3 did not complete measurement)}; \\
      % follow-up - row 7
      % empty first column for intervention group
      & \node [block_assign] (wlc_T36) {Allocated to intervention (n=48): \\
      \h Received intervention (n=46) \\
      \h Did not receive intervention (n=2, \\
      \hh 1 reported low motivation, \\
      \hh 1 could not find time to participate)}; \\
      % follow-up - row 8
      \node [block_lost] (i_T6) {3-months follow-up measurement: \\
      \h Lost to follow-up (n=9, \\
      \hh did not complete measurement)};
      & \node [block_lost] (wlc_T6) {Post-intervention measurement: \\
      \h Lost to follow-up (n=5, \\
      \hh 2 dropped out of the intervention, \\
      \hh 3 did not complete measurement)}; \\
      % follow-up - row 9
      % empty first column for intervention group
      & \node [block_lost] (wlc_T9) {3-months follow-up measurement \\
      \h Lost to follow-up (n=2, \\
      \hh did not complete measurement)}; \\
      % analysis - row 10
      \node [block_assign] (i_ana) {Analysed (n=51)};
      & \node [block_assign] (wlc_ana) {Analysed (n=51)}; \\
    };% end matrix
    % connecting nodes with paths
    \begin{scope}[every path/.style=line]
      % paths for enrollemnt rows
      \path (referred)   -- (excluded1);
      \path (referred)   -- (assessment);
      \path (assessment) -- (excluded2);
      \path (assessment) -- (random);
      \path (random)     -- (i);
      \path (random)     -| (wlc);
      % paths for i-group follow-up rows
      \path (i)          -- (i_T0);
      \path (i_T0)       -- (i_T3);
      \path (i_T3)       -- (i_T6);
      \path (i_T6)       -- (i_ana);
      % paths for wlc-group follow-up rows
      \path (wlc)        -- (wlc_T0);
      \path (wlc_T0)     -- (wlc_T3);
      \path (wlc_T3)     -- (wlc_T36);
      \path (wlc_T36)    -- (wlc_T6);
      \path (wlc_T6)     -- (wlc_T9);
      \path (wlc_T9)     -- (wlc_ana);
    \end{scope}
  \end{tikzpicture}
\end{center}
\end{document}
Click to download: consort-flowchart.tex • consort-flowchart.pdf
Open in Overleaf: consort-flowchart.tex

