


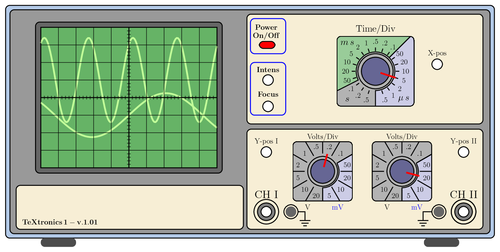
The TeXtronics oscilloscope! It is a basic 2-channels oscilloscope, the kind of machine most students have used in their labs.
Ideally, it should be parameterized so as to be able to easily change the signals and the positions of the different controls.
Edit and compile if you like:
% TeXtronics oscilloscope
% Author: Hugues Vermeiren
\documentclass[a4paper,12pt,oneside]{article}
\usepackage{tikz}
\usepackage[active,tightpage]{preview}
\PreviewEnvironment{tikzpicture}
\setlength\PreviewBorder{5pt}%

\begin{document}
\def\scl{0.6}%scaling factor of the picture
\begin{tikzpicture}[
  scale=\scl,
  controlpanels/.style={yellow!30!brown!20!,rounded corners,draw=black,thick},
  screen/.style={green!50!black!60!,draw=black,thick},
  trace/.style={green!60!yellow!40!, ultra thick},
  smallbutton/.style={white,draw=black, thick},
  axes/.style={thick}]
  \fill[green!30!blue!30!,rounded corners,draw=black,thick](0,0)
    rectangle (27.75,13.25);
  \fill[fill=black!40!,draw=black,thick,rounded corners](0.25,0.25)
    rectangle (27.5,13.00);
  % Screen, centered around the origin then shifted for easy plotting
  \begin{scope}[xshift=7cm,yshift=8cm,samples=150]
    \fill[black!60!,rounded corners,draw=black,thick](-5.3,-4.3)
      rectangle (5.3,4.3);
    \fill[screen] (-5.0,-4.0) rectangle (5.0,4.0);
    \draw[trace] plot(\x,{1+2.4*sin((2.5*\x +1) r)}); % r for radians...
    \draw[trace] plot(\x,{-1+1.25*sin((0.75*\x) r});
    \draw[thin] (-5.0,-4.0) grid (5.0,4.0);
    \draw[axes] (-5,0)--(5,0); % Time axis
    \draw[axes] (0,-4)--(0,4);
    \foreach \i in {-4.8,-4.6,...,4.8} \draw (\i,-0.1)--(\i,0.1);
    \foreach \i in {-3.8,-3.6,...,3.8} \draw (-0.1,\i)--(0.1,\i);
  \end{scope}
  % Feet
  \fill[black!70!,rounded corners,xshift=2cm] (0,-.5) rectangle (2,0);
  \fill[black!70!,rounded corners,xshift=23.75cm] (0,-.5) rectangle (2,0);
  % Lower left panel
  \fill[controlpanels] (0.6,0.5) rectangle (13.5,3.0);
  \path (0.8,0.9) node[scale=\scl,right]{$\mathbf{TeXtronics\,1 - v.1.01}$};
  % Lower right panel
  \fill[controlpanels] (13.7,0.5) rectangle (27.1,6.2);
  %Channels
  % CH I
  \draw[thick] (14.8,1.5) circle (0.7cm);
  \fill[gray,draw=black,thick] (14.8,1.5) circle (0.5cm);
  \fill[white,draw=black,thick] (14.8,1.5) circle (0.3cm);
  \node[scale={1.5*\scl}] at (14.8,2.5) {CH I};
  \draw[thick] (16.2,1.5) circle (0.4cm);
  \fill[black!60!] (16.2,1.5) circle (0.3cm);
  \draw[thick] (16.6,1.5) --(17,1.5)--(17,1.0);
  \draw[thick] (16.7,1.0)--(17.3,1.0);
  \draw[thick] (16.8,0.85)--(17.2,0.85);
  \draw[thick] (16.9,0.70)--(17.1,0.70);
  \draw[thick] (26.0,1.5) circle (0.7cm);
  % CH II
  \fill[gray,draw=black,thick] (26,1.5) circle (0.5cm);
  \fill[white,draw=black,thick] (26,1.5) circle (0.3cm);
  \node[scale={1.5*\scl}] at (26,2.5) {CH II};
  \draw[thick] (24.6,1.5) circle (0.4cm);
  \fill[black!60!] (24.6,1.5) circle (0.3cm);
  \draw[thick] (24.2,1.5) --(23.7,1.5)--(23.7,1.0);
  \draw[thick] (23.4,1.0)--(24.0,1.0);
  \draw[thick] (23.5,0.85)--(23.9,0.85);
  \draw[thick] (23.6,0.70)--(23.8,0.70);
  \draw[thick] (26.0,1.5) circle (0.7cm);
  % Y-pos
  \fill[smallbutton] (14.8,4.9) circle (0.3cm);
  \node[scale={\scl}] at (14.8,5.5) {Y-pos I};
  \fill[smallbutton] (26.0,4.9) circle (0.3cm);
  \node[scale={\scl}] at (26.0,5.5) {Y-pos II};
  % Volt/div the foreach loop draws the two buttons
  \foreach \i / \b in {18/75,22.5/345}{
  %Second parameter of the loop is the angle of the index mark
  \begin{scope}[xshift=\i cm,yshift=3.8cm,scale=0.85]
    \node[scale=\scl] at (0,2.3) {Volts/Div};
    \node[scale=\scl,black] at (-1,-2.4) {V};
    \node[scale=\scl,blue]  at (1,-2.4) {mV};
    \clip[rounded corners] (-2,-2) rectangle (2,2);
    \fill[black!30!,rounded corners,draw=black,thick] (-2,-2)
      rectangle (2,2);
    \fill[blue!50!black!20!,draw=black,thick]
      (30:1.1)--(30:3)--(3,-3)--(-90:3)--(-90:1.1) arc (-90:30:1.1);
    \draw[very thick,rounded corners](-2,-2) rectangle (2,2);
    \draw[thick] (0,0) circle (1.0);
    \foreach \i in {0,30,...,330}
      \draw[thick] (\i:1.2)--(\i:2.5);
    \foreach \i/\j in {15/50,45/.1,75/.2,105/.5,135/1,165/2,195/5,225/10,
      255/20,285/5,315/10,345/20} \node[scale=\scl,black] at (\i:1.7) {\j};
    \fill[blue!30!black!60!,draw=black,thick] (0,0) circle (0.8cm);
    % Here you set the right Volts/Div button
    \draw[ultra thick,red] (\b:0.3)--(\b:1.2);
  \end{scope}}
% Upper right panel
  \fill[controlpanels] (13.7,6.5) rectangle (27.1,12.75);
  %On-Off button
  \draw[rounded corners,thick,blue] (13.9,10.5) rectangle (15.9,12.5);
  \fill[fill=red,draw=black,thick,rounded corners] (14.4,10.8) rectangle (15.3,11.2);
  \node[scale=\scl] at (14.8,12) {\textbf{Power}};
  \node[scale=\scl] at (14.8,11.5) {\textbf{On/Off}};
  % Focus-Intensity buttons
  \draw[rounded corners,thick,blue] (13.9,7.0) rectangle (15.9,10.0);
  \fill[smallbutton] (14.9,7.5) circle (0.3cm);
  \node[scale=\scl] at (14.9,8.2) {\textbf{Focus}};
  \fill[smallbutton] (14.9,9) circle (0.3cm);
  \node[scale=\scl] at (14.9,9.6) {\textbf{Intens}};
  % X-pos
  \fill[smallbutton] (24.5,9.9) circle (0.3cm);
  \node[scale={\scl}] at (24.5,10.5) {X-pos};
  % Time/Div
  \begin{scope}[xshift=21cm,yshift=9.5cm,scale=1]
    \node[scale={1.25*\scl}]  at (0,2.4) {Time/Div};
    \clip[rounded corners] (-2.2,-2) rectangle (2.2,2);
    \fill[black!30!,rounded corners,draw=black,thick] (-2.2,-2) rectangle (2.2,2);
    \fill[blue!50!black!20!,draw=black,thick]
      (45:1.1)--(45:3)--(3,-3)--(-90:3)--(-90:1.1) arc (-90:45:1.1);
    \fill[green!50!black!40!,draw=black,thick]
      (45:1.1)--(45:3) arc(45:207:3) --(207:1.1) arc (207:45:1.1);
    \draw[very thick,rounded corners](-2.2,-2) rectangle (2.2,2);
    \node[scale={1.25*\scl}] at (-1.6,-1.6) {$s$};
    \node[scale={1.25*\scl}] at (1.6,-1.6) {$\mu{}\,s$};
    \node[scale={1.25*\scl}] at (-1.6,1.6) {$m\,s$};
    \draw[thick] (0,0) circle (1.0);
    \foreach \i in {-72,-54,...,262} \draw[thick] (\i:1.15)--(\i:1.35);
    \foreach \i/\j in {-72/.5,-54/1,-36/2,-18/5,0/10,18/20,36/50,54/.1,72/.2,90/.5,
      108/1,126/2,144/5,162/10,180/20,198/50,216/.1,234/.2,252/.5}
      \node[scale=\scl,black] at (\i:1.7){\j};
    \fill[blue!30!black!60!,draw=black,thick] (0,0) circle (0.8cm);
    % Here you set the Time/Div button
    \draw[ultra thick,red] (-18:0.3)--(-18:1.2);
    % X-pos
  \end{scope}
\end{tikzpicture}
\end{document}
Click to download: textronics-oscilloscope.tex • textronics-oscilloscope.pdf
Open in Overleaf: textronics-oscilloscope.tex