")


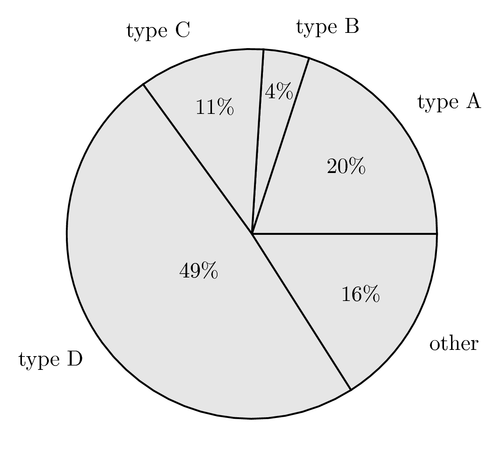
This example shows how to draw a basic pie chart. Note that labels are automatically aligned and placed in a smart way. This makes the code more complicated. However, charts can now bee drawn without worrying about overlapping labels.
Edit and compile if you like:
% Pie chart
% Author: Robert Vollmert
\documentclass{article}

\usepackage{calc}
\usepackage{ifthen}
\usepackage{tikz}

\usepackage[active,floats,tightpage]{preview}
\PreviewEnvironment{tikzpicture}
\setlength\PreviewBorder{5pt}%

\begin{document}


\newcommand{\slice}[4]{
  \pgfmathparse{0.5*#1+0.5*#2}
  \let\midangle\pgfmathresult

  % slice
  \draw[thick,fill=black!10] (0,0) -- (#1:1) arc (#1:#2:1) -- cycle;

  % outer label
  \node[label=\midangle:#4] at (\midangle:1) {};

  % inner label
  \pgfmathparse{min((#2-#1-10)/110*(-0.3),0)}
  \let\temp\pgfmathresult
  \pgfmathparse{max(\temp,-0.5) + 0.8}
  \let\innerpos\pgfmathresult
  \node at (\midangle:\innerpos) {#3};
}

\begin{tikzpicture}[scale=3]

\newcounter{a}
\newcounter{b}
\foreach \p/\t in {20/type A, 4/type B, 11/type C,
                   49/type D, 16/other}
  {
    \setcounter{a}{\value{b}}
    \addtocounter{b}{\p}
    \slice{\thea/100*360}
          {\theb/100*360}
          {\p\%}{\t}
  }

\end{tikzpicture}

\end{document}
Click to download: pie-chart.tex • pie-chart.pdf
Open in Overleaf: pie-chart.tex